DPWX/Contrasting rhoHV levels in hail: 24 May 2016 vs. 30 July 2016: Difference between revisions
Pat kennedy (talk | contribs) (Starting text additions.) |
Pat kennedy (talk | contribs) (Adding more text.) |
||
| Line 1: | Line 1: | ||
==Overview== | ==Overview== | ||
Hail-producing thunderstorms were observed on multiple occasions by the CSU-CHILL radar during 2016. The storms on the afternoon of 24 May and the evening of 29 July (30 July on UTC) produced significantly different hail sizes. A post-storm survey conducted after the 24 May storm affected the Windsor Colorado area yielded photographic evidence that the ground was locally covered by hail. The maximum reported hail diameter was 0.75 inches (19 mm). In contrast, a cluster of severe thunderstorms that passed over the CHILL radar site during the early evening hours of 29 July produced multiple reports of hail in the 1 - 2 inch diameter range, and two reports of 2.5 inch (tennis ball) sized hail. (An overview of the 29 July 2016 event is available '''[[ DPWX/Severe thunderstorm activity near CSU-CHILL: 29 July 2016.|here.]]''') The radial velocity patterns in the following RHI scan imply that a well-organized updraft was present at 0130 UTC. This RHI was nearly coincident with an SPC report of 2.5 inch diameter hail at the indicated location. | |||
[[Image:RHI 30jul2016 0130 anot.png|center]] | [[Image:RHI 30jul2016 0130 anot.png|center]] | ||
==S-band dual polarization patterns in the 24 May and 30 July 2016 hailstorms== | ==S-band dual polarization patterns in the 24 May and 30 July 2016 hailstorms== | ||
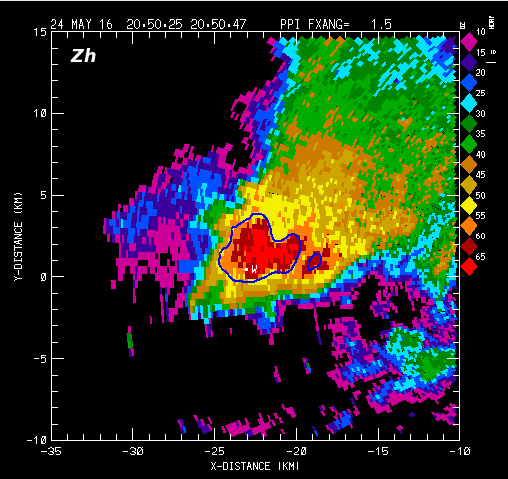
The following series of plots show low elevation PPI scan data from these two hail events. Clicking on the "Fwd" screen button will advance the displayed image through a sequence of four data fields (Zh, Zdr, rhoHV x 10, and LDR). The upper frame shows the data from the 24 May storm; the 30 July (UTC date) severe storm is shown in the lower frame. For both cases, an indication of the hail region boundary is shown by the solid +10 dB HDR contour (Aydin et al. JAMC 1986, p. 1509). Observed hail diameter locations are marked by letters: "W" in the 24 May storm was a 0.75 inch hail report. "C" and "S" in the 30 July storm are 2.5 inch diameter reports. | |||
<center> | <center> | ||
<imgloop delay=1000 imgprefix="http://www.chill.colostate.edu/anim/april_2017_hail_rho/" width=508 height=479> | <imgloop delay=1000 imgprefix="http://www.chill.colostate.edu/anim/april_2017_hail_rho/" width=508 height=479> | ||
| Line 23: | Line 24: | ||
</center> | </center> | ||
In both storms, the hail regions are associated with the the joint existence of very high reflectivity and near 0 dB Zdr. The large hailstone diameters (in comparison to raindrops) contribute to the high reflectivity levels. The quasi-random orientations of the tumbling hailstones tends to equalize the received power at horizontal and vertical polarization; producing near 0 dB Zdr. Reductions in rhoHV to levels below ~0.90 have been associated with larger diameter hail (Ryzhkov et al. JAMC 2013 p. 2871; Fig. 1). Appreciably lower rhoHV levels occurred in 30 July 2016 storm, with values below 0.9 noted near spotter report "C". (The 2.5 inch hail report from point "S" was filed ~10 minutes after the PPI data time). The maximum hail diameters in the July storm were large enough to begin to show Mie resonance effects at the CSU-CHILL radar's 11 cm wavelength. The differential phase shift upon backscatter effects associated with Mie scattering can be an important factor in reducing rhoHV. | |||
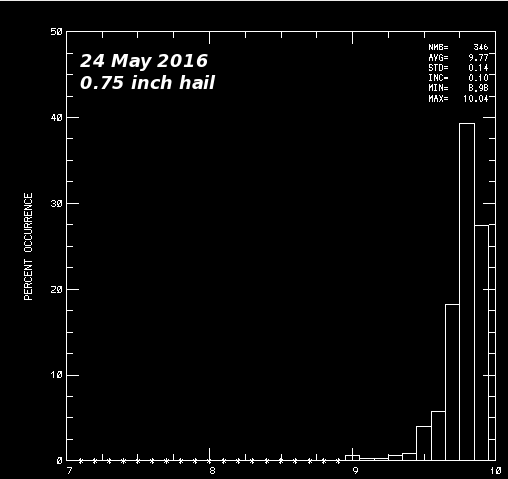
==RhoHV histograms in the 24 May and 30 July 2016 hail areas== | |||
<center> | <center> | ||
<imgloop delay=1000 imgprefix="http://www.chill.colostate.edu/anim/april_2017_hail_rho/" width=508 height=479> | <imgloop delay=1000 imgprefix="http://www.chill.colostate.edu/anim/april_2017_hail_rho/" width=508 height=479> | ||
Revision as of 15:44, 24 March 2017
Overview
Hail-producing thunderstorms were observed on multiple occasions by the CSU-CHILL radar during 2016. The storms on the afternoon of 24 May and the evening of 29 July (30 July on UTC) produced significantly different hail sizes. A post-storm survey conducted after the 24 May storm affected the Windsor Colorado area yielded photographic evidence that the ground was locally covered by hail. The maximum reported hail diameter was 0.75 inches (19 mm). In contrast, a cluster of severe thunderstorms that passed over the CHILL radar site during the early evening hours of 29 July produced multiple reports of hail in the 1 - 2 inch diameter range, and two reports of 2.5 inch (tennis ball) sized hail. (An overview of the 29 July 2016 event is available here.) The radial velocity patterns in the following RHI scan imply that a well-organized updraft was present at 0130 UTC. This RHI was nearly coincident with an SPC report of 2.5 inch diameter hail at the indicated location.

S-band dual polarization patterns in the 24 May and 30 July 2016 hailstorms
The following series of plots show low elevation PPI scan data from these two hail events. Clicking on the "Fwd" screen button will advance the displayed image through a sequence of four data fields (Zh, Zdr, rhoHV x 10, and LDR). The upper frame shows the data from the 24 May storm; the 30 July (UTC date) severe storm is shown in the lower frame. For both cases, an indication of the hail region boundary is shown by the solid +10 dB HDR contour (Aydin et al. JAMC 1986, p. 1509). Observed hail diameter locations are marked by letters: "W" in the 24 May storm was a 0.75 inch hail report. "C" and "S" in the 30 July storm are 2.5 inch diameter reports.
|
|
||
|
|
|
||
|
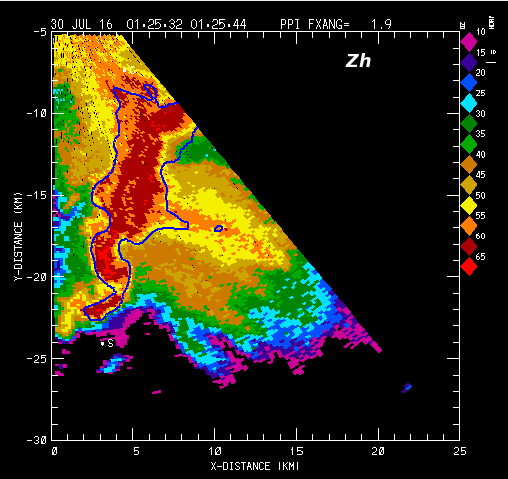
In both storms, the hail regions are associated with the the joint existence of very high reflectivity and near 0 dB Zdr. The large hailstone diameters (in comparison to raindrops) contribute to the high reflectivity levels. The quasi-random orientations of the tumbling hailstones tends to equalize the received power at horizontal and vertical polarization; producing near 0 dB Zdr. Reductions in rhoHV to levels below ~0.90 have been associated with larger diameter hail (Ryzhkov et al. JAMC 2013 p. 2871; Fig. 1). Appreciably lower rhoHV levels occurred in 30 July 2016 storm, with values below 0.9 noted near spotter report "C". (The 2.5 inch hail report from point "S" was filed ~10 minutes after the PPI data time). The maximum hail diameters in the July storm were large enough to begin to show Mie resonance effects at the CSU-CHILL radar's 11 cm wavelength. The differential phase shift upon backscatter effects associated with Mie scattering can be an important factor in reducing rhoHV.
RhoHV histograms in the 24 May and 30 July 2016 hail areas
|
|
||
|