DPWX/Cold frontal passage: 23 September 2016
Overview
A strong surface cold frontal passage was observed at the CSU-CHILL radar site during the afternoon hours of 23 September 2016. Various PPI and RHI scans were used to collect data as the fine line echo associated with the frontal boundary approached and then passed over the radar while moving from the northwest towards the southeast. Selected aspects of this frontal passage have been documented using data from the CSU-CHILL's S and X-band channels.
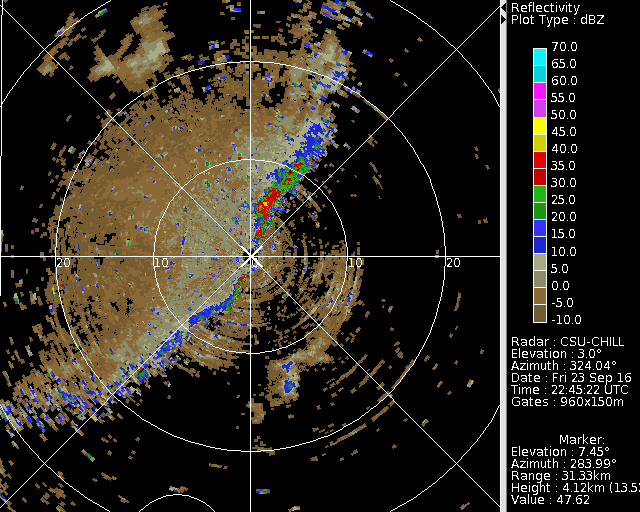
S-band Reflectivity loop
The following sequence of 3 degree elevation 360 surveillance scans show the S-band reflectivity pattern as the frontal passage occurred at the radar site. The highest reflectivity values were located along the leading edge of the frontal boundary. The lower reflectivities trailing the fine line were apparently associated with the blowing dust that was observed immediately behind the front. The automated surface weather observations recorded at the Greeley Weld County airport adjacent to the radar site included a prevailing visibility reduction to 4 statute miles just after a 180 degree wind shift associated with the front. The loop also contains a few weak rain shower echoes in the area just southeast of the radar.
|
|
||
|
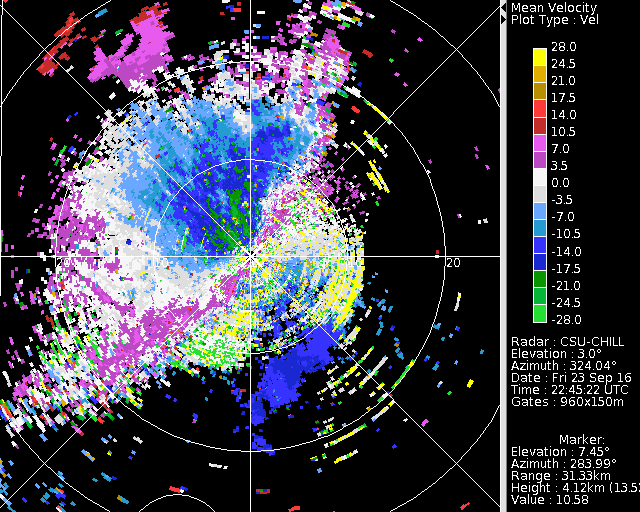
S-band Radial velocity loop
The radial velocity data from the same series of surveillance scans is shown below. Strong (~ +20 mps) radial velocities appear the the southeast side of the radar after the passage of the frontal fine line echo.
|
|
||
|
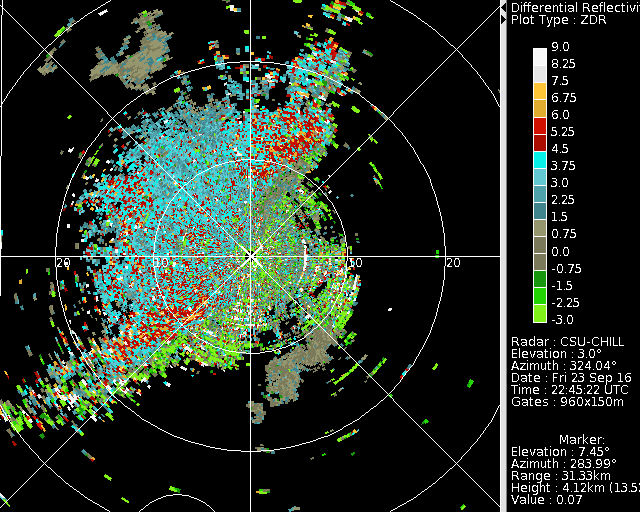
S-band Differential reflectivity loop
The S-band differential reflectivity (Zdr) patterns in the same surveillance scan sequence contains three general regimes: (1) Near 0 dB values in the light rain showers immediately ahead of the front. (2) Generally positive Zdr in the post-frontal dust / surface debris echo. (3) A narrow band of negative Zdr along the fine line echo. These negative Zdr values suggest that vertical scatterer orientations apparently prevail as the strong post-frontal winds first loft debris from the surface.
|
|
||
|
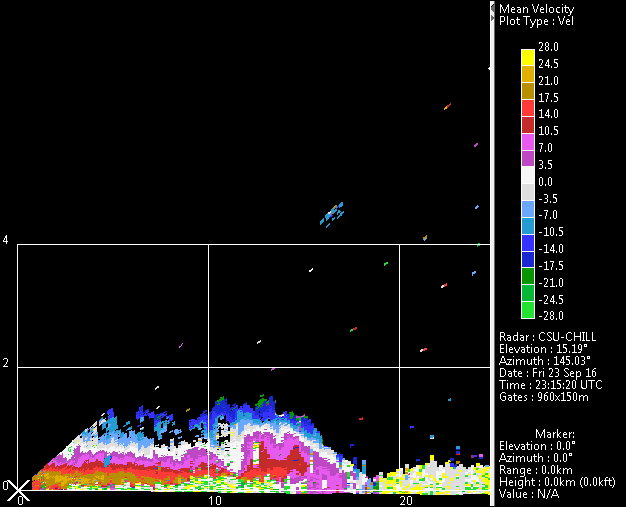
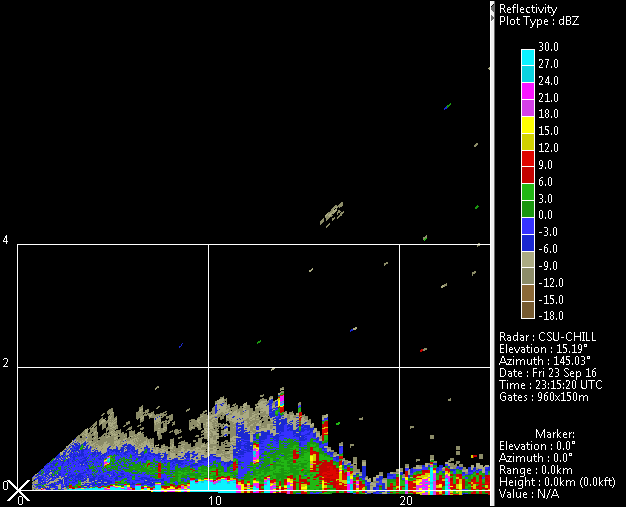
X-band RHI data at 2254 UTC
Immediately following the surveillance sequence shown above, a series of RHI scans were done through departing fine line echo. The 142 degree RHI scans intersected the collision between the front and one of the light rain showers that occurred just southeast of the radar.


S-band RHI reflectivity loop
|
|
||
|
S-band RHI radial velocity loop
|
|
||
|