DPWX/Cold frontal passage: 23 September 2016: Difference between revisions
Pat kennedy (talk | contribs) (Initial text entries.) |
Pat kennedy (talk | contribs) No edit summary |
||
| Line 46: | Line 46: | ||
==X-band RHI data at 2254 UTC== | ==X-band RHI data at 2254 UTC== | ||
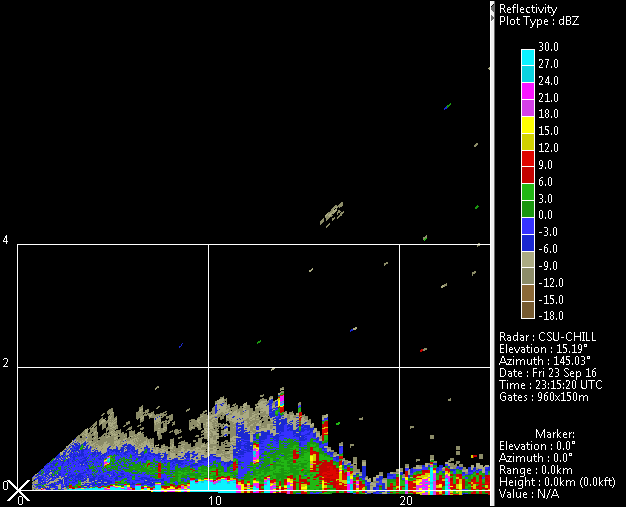
Immediately following the surveillance sequence shown above, a series of RHI scans were done through departing fine line echo. The 142 degree RHI scans intersected the collision between the front and one of the light rain showers that occurred just southeast of the radar. | Immediately following the surveillance sequence shown above, a series of RHI scans were done through departing fine line echo. The 142 degree RHI scans intersected the collision between the front and one of the light rain showers that occurred just southeast of the radar. The narrow beam width and low sidelobes of the CSU-CHILL X-band channel minimized ground clutter contamination. Reflectivity levels were similar in both the surface-based cold frontal echo and in the more vertically oriented rain shower. | ||
[[Image:01 23sept2016 2254 XB dbz anot.png|center]] | [[Image:01 23sept2016 2254 XB dbz anot.png|center]] | ||
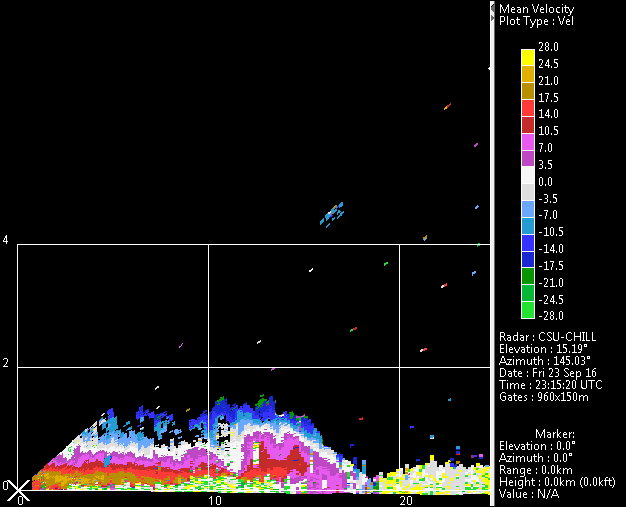
The corresponding radial velocity pattern showed the well-defined convergence at the frontal surface. The radial velocity couplet centered near range = 6 km, height = ~800m suggest that rotation about a horizontal axis existed in the RHI plane. | |||
[[Image:02 23sept2016 2254 XB vr anot.png|center]] | [[Image:02 23sept2016 2254 XB vr anot.png|center]] | ||
The following plot shows the Zdr field. The small, quasi-spherical drops in the rain shaft produce near 0 dB Zdr; predominantly positive Zdr values prevailed in the post-frontal echo. As was true in the S-band surveillance scans, a small area of negative Zdr existed along the leading edge of the front. | |||
[[Image:03 23sept2016 2254 XB Zdr anot.png|center]] | [[Image:03 23sept2016 2254 XB Zdr anot.png|center]] | ||
The final plot shows the X-band rhoHV field with the basic correlation values multiplied by 10. Correlation levels are distinctly lower in the non-precipitation frontal echo vs. the rain shower. | |||
[[Image:04 23sept2016 2254 XB rho10 anot.png|center]] | [[Image:04 23sept2016 2254 XB rho10 anot.png|center]] | ||
| Line 64: | Line 66: | ||
==S-band RHI reflectivity loop== | ==S-band RHI reflectivity loop== | ||
The final loops show S-band RHI data collected at a later time when the front had moved out to a range of ~18 - 23 km. The reflectivity pattern suggested the development of billows in the air that was being lifted over the advancing front. | |||
<center> | <center> | ||
<imgloop delay=200 imgprefix="http://www.chill.colostate.edu/anim/nov_2016_23sept2015_CFROPA/RHI_frames/" width=626 height=507> | <imgloop delay=200 imgprefix="http://www.chill.colostate.edu/anim/nov_2016_23sept2015_CFROPA/RHI_frames/" width=626 height=507> | ||
| Line 92: | Line 96: | ||
==S-band RHI radial velocity loop== | ==S-band RHI radial velocity loop== | ||
The corresponding radial velocity field is shown in the final loop. The vertical shear, with strong outbound (positive sign) flow in the near-surface cold airmass surmounted by strong inbound (negative sign) flow in lifted, warmer airmass is apparent. | |||
<center> | <center> | ||
<imgloop delay=200 imgprefix="http://www.chill.colostate.edu/anim/nov_2016_23sept2015_CFROPA/RHI_frames/" width=626 height=507> | <imgloop delay=200 imgprefix="http://www.chill.colostate.edu/anim/nov_2016_23sept2015_CFROPA/RHI_frames/" width=626 height=507> | ||
Revision as of 18:08, 29 October 2016
Overview
A strong surface cold frontal passage was observed at the CSU-CHILL radar site during the afternoon hours of 23 September 2016. Various PPI and RHI scans were used to collect data as the fine line echo associated with the frontal boundary approached and then passed over the radar while moving from the northwest towards the southeast. Selected aspects of this frontal passage have been documented using data from the CSU-CHILL's S and X-band channels.
S-band Reflectivity loop
The following sequence of 3 degree elevation 360 surveillance scans show the S-band reflectivity pattern as the frontal passage occurred at the radar site. The highest reflectivity values were located along the leading edge of the frontal boundary. The lower reflectivities trailing the fine line were apparently associated with the blowing dust that was observed immediately behind the front. The automated surface weather observations recorded at the Greeley Weld County airport adjacent to the radar site included a prevailing visibility reduction to 4 statute miles just after a 180 degree wind shift associated with the front. The loop also contains a few weak rain shower echoes in the area just southeast of the radar.
|
|
||
|
S-band Radial velocity loop
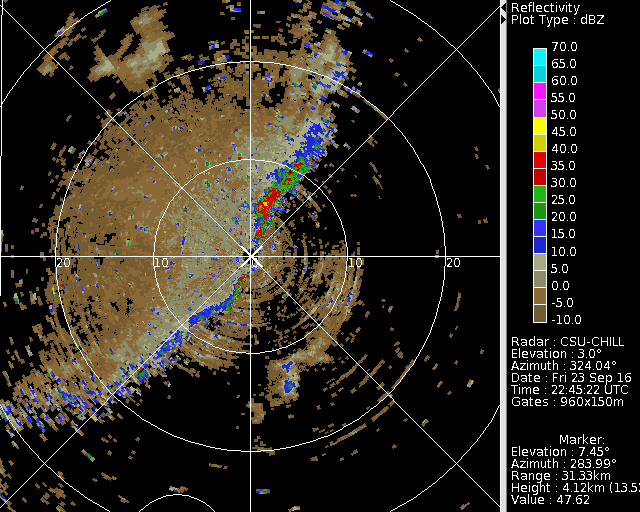
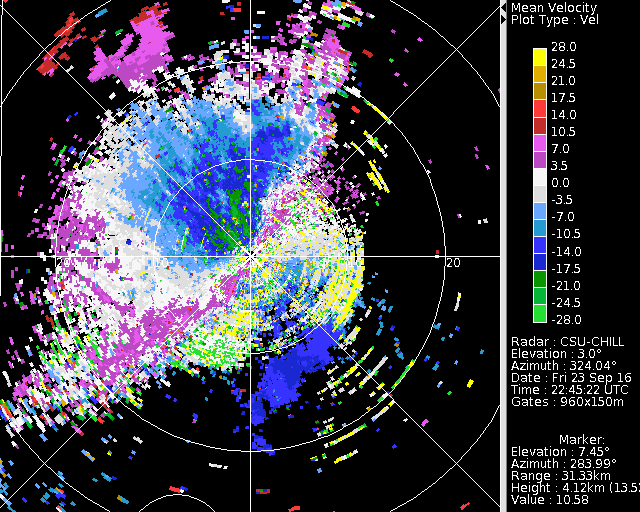
The radial velocity data from the same series of surveillance scans is shown below. Strong (~ +20 mps) radial velocities appear the the southeast side of the radar after the passage of the frontal fine line echo.
|
|
||
|
S-band Differential reflectivity loop
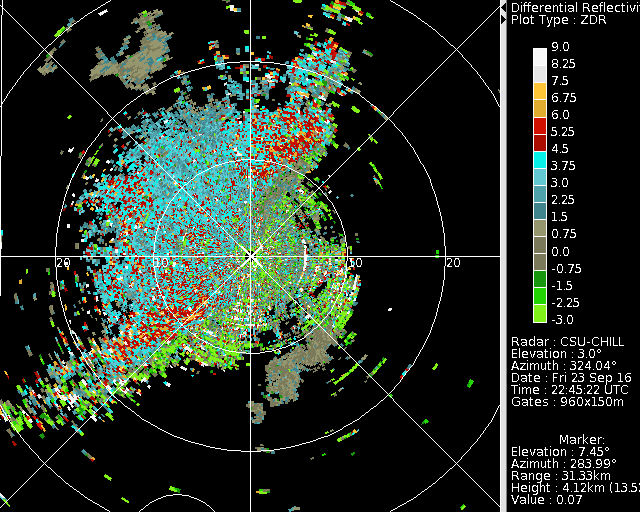
The S-band differential reflectivity (Zdr) patterns in the same surveillance scan sequence contains three general regimes: (1) Near 0 dB values in the light rain showers immediately ahead of the front. (2) Generally positive Zdr in the post-frontal dust / surface debris echo. (3) A narrow band of negative Zdr along the fine line echo. These negative Zdr values suggest that vertical scatterer orientations apparently prevail as the strong post-frontal winds first loft debris from the surface.
|
|
||
|
X-band RHI data at 2254 UTC
Immediately following the surveillance sequence shown above, a series of RHI scans were done through departing fine line echo. The 142 degree RHI scans intersected the collision between the front and one of the light rain showers that occurred just southeast of the radar. The narrow beam width and low sidelobes of the CSU-CHILL X-band channel minimized ground clutter contamination. Reflectivity levels were similar in both the surface-based cold frontal echo and in the more vertically oriented rain shower.

The corresponding radial velocity pattern showed the well-defined convergence at the frontal surface. The radial velocity couplet centered near range = 6 km, height = ~800m suggest that rotation about a horizontal axis existed in the RHI plane.

The following plot shows the Zdr field. The small, quasi-spherical drops in the rain shaft produce near 0 dB Zdr; predominantly positive Zdr values prevailed in the post-frontal echo. As was true in the S-band surveillance scans, a small area of negative Zdr existed along the leading edge of the front.

The final plot shows the X-band rhoHV field with the basic correlation values multiplied by 10. Correlation levels are distinctly lower in the non-precipitation frontal echo vs. the rain shower.

S-band RHI reflectivity loop
The final loops show S-band RHI data collected at a later time when the front had moved out to a range of ~18 - 23 km. The reflectivity pattern suggested the development of billows in the air that was being lifted over the advancing front.
|
|
||
|
S-band RHI radial velocity loop
The corresponding radial velocity field is shown in the final loop. The vertical shear, with strong outbound (positive sign) flow in the near-surface cold airmass surmounted by strong inbound (negative sign) flow in lifted, warmer airmass is apparent.
|
|
||
|