Cell intensification following a boundary passage: 30 August 2013: Difference between revisions
Pat kennedy (talk | contribs) (added overview) |
m (Added references, categories, math mode) |
||
| Line 7: | Line 7: | ||
==Introduction== | ==Introduction== | ||
During the late afternoon hours of 30 August 2013 the CSU-CHILL radar conducted 360 surveillance PPI volumes composed of two elevation angles: 0.75 and 1.25 | During the late afternoon hours of 30 August 2013 the CSU-CHILL radar conducted 360 surveillance PPI volumes composed of two elevation angles: 0.75° and 1.25°. These volumes repeated every ~1.5 minutes, providing high time resolution observations of the interactions between several boundary layer echo features and some evolving showers to the east of the radar. The storm of interest was located approximately 30 km southeast of the radar as a fine line echo approached it from the north-northeast at 2329 UTC. The following plot shows the reflectivity data observed in the 1.25° elevation S-band data: | ||
[[Image:30aug2013 S dBZ anot.png|center]] | [[Image:30aug2013 S dBZ anot.png|center]] | ||
The radial velocity patterns indicated that localized convergence was present along the fine line echo. This is most evident along the Y=0 / 090 deg azimuth line where the sign of the radial velocities changes from positive (outbound) at ~27 km range to negative (inbound) at ~33 km range: | The radial velocity patterns indicated that localized convergence was present along the fine line echo. This is most evident along the Y=0 / 090° azimuth line where the sign of the radial velocities changes from positive (outbound) at ~27 km range to negative (inbound) at ~33 km range: | ||
[[Image:30aug2013 VR ovly anot.png|center]] | [[Image:30aug2013 VR ovly anot.png|center]] | ||
| Line 17: | Line 17: | ||
==Attenuation-corrected reflectivity X-band loop== | ==Attenuation-corrected reflectivity X-band loop== | ||
The radar was in dual frequency mode during this operation. Due to the narrow (0.3 deg) beamwidth, the X-band data provides a high spatial resolution view of the echo evolution. The following loop of attenuation-corrected X-band reflectivity data shows that several fine line echoes moved past the storm of interest. Reflectivity briefly maximized around 2333 UTC. This intensification was probably due to updraft strengthening in response to the increased low level convergence associated with the passing fine line echoes. | The radar was in dual frequency mode during this operation. Due to the narrow (0.3°) beamwidth, the X-band data provides a high spatial resolution view of the echo evolution. The following loop of attenuation-corrected X-band reflectivity data shows that several fine line echoes moved past the storm of interest. Reflectivity briefly maximized around 2333 UTC. This intensification was probably due to updraft strengthening in response to the increased low level convergence associated with the passing fine line echoes. | ||
<center> | <center> | ||
| Line 48: | Line 48: | ||
</center> | </center> | ||
==Differential attenuation-corrected X-band | ==Differential attenuation-corrected X-band <math>Z_{dr}</math> loop== | ||
The next loop shows the attenuation-corrected | The next loop shows the attenuation-corrected <math>Z_{dr}</math> data from the same PPI data sequence. Negatively-biased <math>Z_{dr}</math> values appear downrange of the echo core during the brief period of maximum intensity. This differential attenuation pattern may be due to the presence of melting graupel with a water coating thickness that maximizes around the particle's equator and reduces random tumbling motions (Rasmussen and Heymsfield JAS 1987 p2754-2763.) The presence of such oblate melting ice particles would increase the attenuation of the H waves relative to that of the V waves, producing a negative <math>Z_{dr}</math> "shadow". | ||
<center> | <center> | ||
<imgloop delay=200 imgprefix="http://www.chill.colostate.edu/anim/dec2013_x_cell_boundaries/" width=640 height=512> | <imgloop delay=200 imgprefix="http://www.chill.colostate.edu/anim/dec2013_x_cell_boundaries/" width=640 height=512> | ||
| Line 80: | Line 80: | ||
==X-band differential propagation phase loop== | ==X-band differential propagation phase (<math>\psi_{dp}</math>) loop== | ||
The largest differential propagation phase shifts also coincided with the period of maximum echo intensity. The enhanced concentrations of oblate rain drops, probably augmented by the above-mentioned melting graupel particles, lead to the brief existence of total of total two-way phase shift accumulations approaching 100 deg. | The largest differential propagation phase (<math>\psi_{dp}</math>) shifts also coincided with the period of maximum echo intensity. The enhanced concentrations of oblate rain drops, probably augmented by the above-mentioned melting graupel particles, lead to the brief existence of total of total two-way phase shift accumulations approaching 100 deg. | ||
<center> | <center> | ||
| Line 113: | Line 113: | ||
==Specific differential propagation ( | ==Specific differential propagation (<math>K_{dp}</math>) loop== | ||
Maximum X-band one-way specific propagation differential phase ( | Maximum X-band one-way specific propagation differential phase (<math>K_{dp}</math>) reached ~ 6 deg / km, implying peak rainfall rates of ~80 mm / hr. | ||
<center> | <center> | ||
| Line 148: | Line 148: | ||
Convergence along low-level boundaries can be a significant factor in the initiation and intensification of showers and thunderstorms (Wilson and Schreiber, MWR 1986 p2516-2536). Based on high time resolution radar data, storm-boundary interactions can lead to appreciable variations in rain rate, etc. on time scales of 1 - 3 minutes. | Convergence along low-level boundaries can be a significant factor in the initiation and intensification of showers and thunderstorms (Wilson and Schreiber, MWR 1986 p2516-2536). Based on high time resolution radar data, storm-boundary interactions can lead to appreciable variations in rain rate, etc. on time scales of 1 - 3 minutes. | ||
==References== | |||
* Rasmussen, Roy M., Andrew J. Heymsfield, 1987: [http://dx.doi.org/10.1175/1520-0469(1987)044%3C2754%3AMASOGA%3E2.0.CO%3B2 Melting and Shedding of Graupel and Hail. Part I: Model Physics.] ''J. Atmos. Sci.'', '''44''', 2754–2763. | |||
* Rasmussen, Roy M., Andrew J. Heymsfield, 1987: [http://dx.doi.org/10.1175/1520-0469(1987)044%3C2764%3AMASOGA%3E2.0.CO%3B2 Melting and Shedding of Graupel and Hail. Part II: Sensitivity Study.] ''J. Atmos. Sci.'', '''44''', 2764–2782. | |||
* Rasmussen, Roy M., Andrew J. Heymsfield, 1987: [http://dx.doi.org/10.1175/1520-0469(1987)044%3C2783%3AMASOGA%3E2.0.CO%3B2 Melting and Shedding of Graupel and Hail. Part III: Investigation of the Role of Shed Drops as Hail Embryos in the 1 August CCOPE Severe Storm.] ''J. Atmos. Sci.'', '''44''', 2783–2803. | |||
* Wilson, James W., Wendy E. Schreiber, 1986: [http://dx.doi.org/10.1175/1520-0493(1986)114%3C2516%3AIOCSAR%3E2.0.CO%3B2 Initiation of Convective Storms at Radar-Observed Boundary-Layer Convergence Lines.] ''Mon. Wea. Rev.'', '''114''', 2516–2536. | |||
[[Category:Featured Articles]] | [[Category:Featured Articles]] | ||
[[Category:Differential Attenuation]] | [[Category:Differential Attenuation]] | ||
[[Category:Gust Front]] | |||
[[Category:Dual Wavelength]] | |||
Latest revision as of 12:44, 4 December 2013
Author: P. C. Kennedy

X-band reflectivity data collected as a fine line echo approached a small thunderstorm on 30 August 2013. Time lapse animations captured a brief intensification of the storm due to the enhanced low-level convergence along the fine line echo.
Introduction
During the late afternoon hours of 30 August 2013 the CSU-CHILL radar conducted 360 surveillance PPI volumes composed of two elevation angles: 0.75° and 1.25°. These volumes repeated every ~1.5 minutes, providing high time resolution observations of the interactions between several boundary layer echo features and some evolving showers to the east of the radar. The storm of interest was located approximately 30 km southeast of the radar as a fine line echo approached it from the north-northeast at 2329 UTC. The following plot shows the reflectivity data observed in the 1.25° elevation S-band data:

The radial velocity patterns indicated that localized convergence was present along the fine line echo. This is most evident along the Y=0 / 090° azimuth line where the sign of the radial velocities changes from positive (outbound) at ~27 km range to negative (inbound) at ~33 km range:

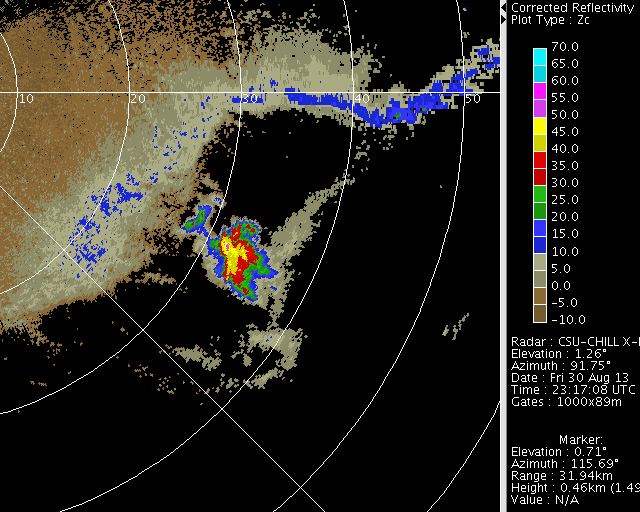
Attenuation-corrected reflectivity X-band loop
The radar was in dual frequency mode during this operation. Due to the narrow (0.3°) beamwidth, the X-band data provides a high spatial resolution view of the echo evolution. The following loop of attenuation-corrected X-band reflectivity data shows that several fine line echoes moved past the storm of interest. Reflectivity briefly maximized around 2333 UTC. This intensification was probably due to updraft strengthening in response to the increased low level convergence associated with the passing fine line echoes.
|
|
||
|
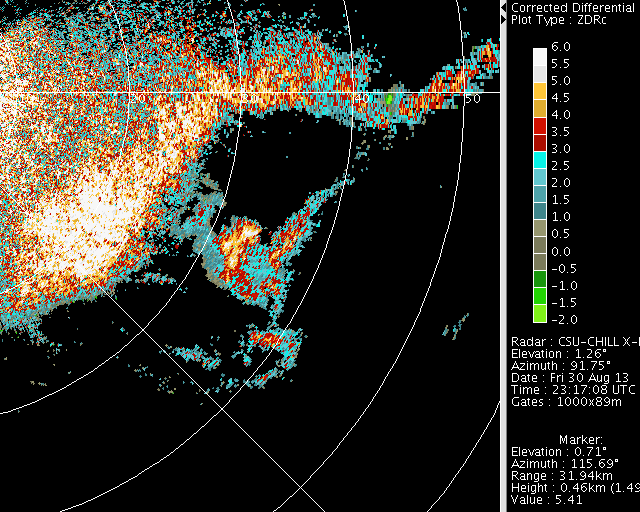
Differential attenuation-corrected X-band loop

The next loop shows the attenuation-corrected data from the same PPI data sequence. Negatively-biased values appear downrange of the echo core during the brief period of maximum intensity. This differential attenuation pattern may be due to the presence of melting graupel with a water coating thickness that maximizes around the particle's equator and reduces random tumbling motions (Rasmussen and Heymsfield JAS 1987 p2754-2763.) The presence of such oblate melting ice particles would increase the attenuation of the H waves relative to that of the V waves, producing a negative "shadow".
|
|
||
|
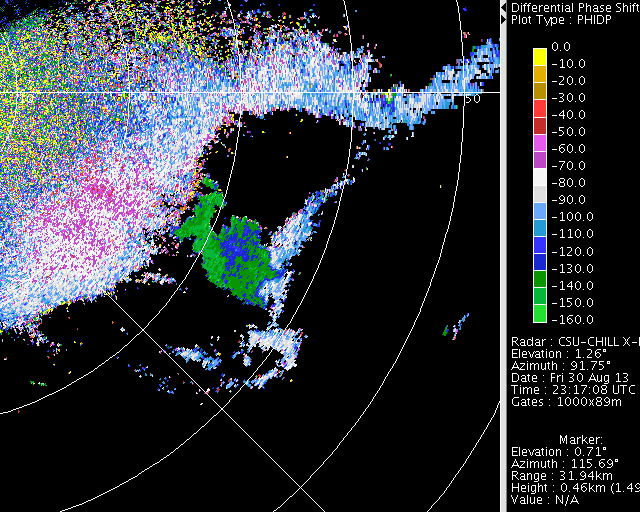
X-band differential propagation phase () loop

The largest differential propagation phase () shifts also coincided with the period of maximum echo intensity. The enhanced concentrations of oblate rain drops, probably augmented by the above-mentioned melting graupel particles, lead to the brief existence of total of total two-way phase shift accumulations approaching 100 deg.
|
|
||
|
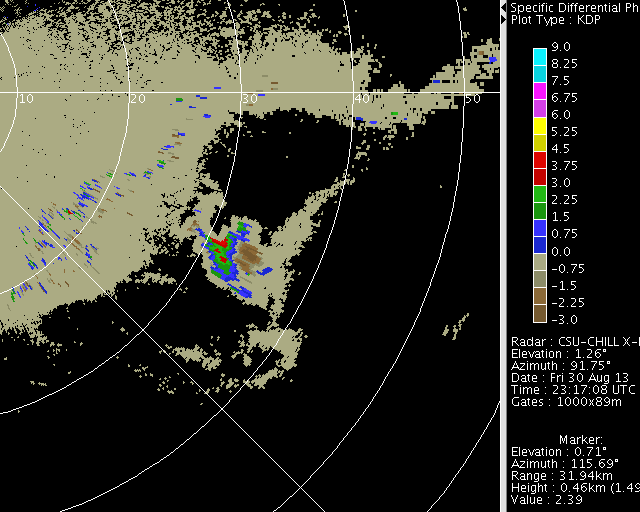
Specific differential propagation () loop

Maximum X-band one-way specific propagation differential phase () reached ~ 6 deg / km, implying peak rainfall rates of ~80 mm / hr.
|
|
||
|
Summary
Convergence along low-level boundaries can be a significant factor in the initiation and intensification of showers and thunderstorms (Wilson and Schreiber, MWR 1986 p2516-2536). Based on high time resolution radar data, storm-boundary interactions can lead to appreciable variations in rain rate, etc. on time scales of 1 - 3 minutes.
References
- Rasmussen, Roy M., Andrew J. Heymsfield, 1987: Melting and Shedding of Graupel and Hail. Part I: Model Physics. J. Atmos. Sci., 44, 2754–2763.
- Rasmussen, Roy M., Andrew J. Heymsfield, 1987: Melting and Shedding of Graupel and Hail. Part II: Sensitivity Study. J. Atmos. Sci., 44, 2764–2782.
- Rasmussen, Roy M., Andrew J. Heymsfield, 1987: Melting and Shedding of Graupel and Hail. Part III: Investigation of the Role of Shed Drops as Hail Embryos in the 1 August CCOPE Severe Storm. J. Atmos. Sci., 44, 2783–2803.
- Wilson, James W., Wendy E. Schreiber, 1986: Initiation of Convective Storms at Radar-Observed Boundary-Layer Convergence Lines. Mon. Wea. Rev., 114, 2516–2536.