Bright band polarimetric signatures: Difference between revisions
No edit summary |
m (Fixed image formatting to be more sane) |
||
| (One intermediate revision by the same user not shown) | |||
| Line 1: | Line 1: | ||
Reflectivity | ==Conceptual Summary== | ||
Frozen hydrometeors begin to melt as they fall through the 0°C height level. The first hydrometeors to completely melt are the smaller, less massive particles. The larger particles spend more time in various partially frozen/water-coated states as they melt while descending. Additionally, particle aggregation and breakup also frequently occur at temperatures near 0°C. The net result of these processes often generates distinctive polarimetric signatures. Reflectivity is enhanced as the particles initially develop a wet outer surface, producing the classical "bright band" pattern. With increasing distance below the 0°C level, only the larger sized hydrometeors remain partially frozen. However, due to their large diameters, they strongly influence the polarimetric parameters <ref name="herzegh">Herzegh, P. H. and A. R. Jameson. 1992: Observing Precipitation through Dual-Polarization Radar. Bull. Amer. Meteor. Soc., 73, pp 1365-1374.</ref>. These large melting snow particles generally wobble as they fall; on average the orientation of their long axis is more nearly horizontal than vertical. | |||
The large particles thus cause the most positive <math>Z_{dr}</math> and the least negative LDR values to be found several hundred meters below the height of the maximum reflectivity. At lower heights, these radar signal peaks fade out as the hydrometeors completely melt into quasi-spherical drops. | |||
The large particles thus cause the most positive | |||
[[Image: | <center> | ||
[[Image: | {| {{Prettytable}} | ||
! {{Hl3}} | PPI display of Reflectivity and <math>\rho_{HV}</math> | |||
|- | |||
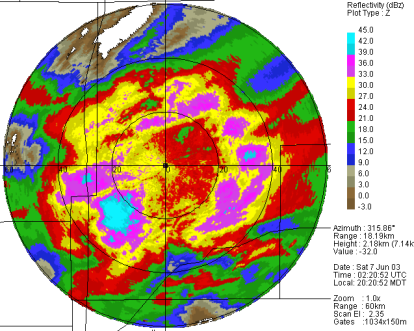
| [[Image:7jun03_yellow_dbz.png|Reflectivity PPI plot]] | |||
|- | |||
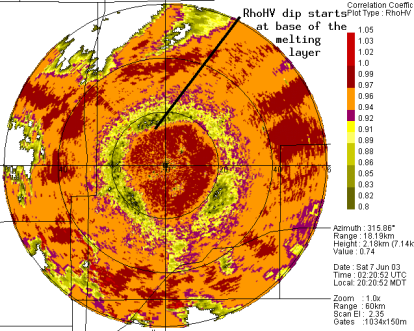
| [[Image:7jun03_yel_rh_anot.png|Annotated <math>\rho_{HV}</math> PPI plot]] | |||
|} | |||
</center> | |||
=VCHILL= | |||
Examples of these general bright band patterns are shown in the above overlay plots. It is apparent that the <math>Z_{dr}</math> and LDR peaks are found somewhat below the maximum reflectivity height. The correlation between the horizontally and vertically polarized return signals (<math>\rho_{HV}</math>) also has a distinct minimum in the vicinity of the melting level. The coexistence of small, completely melted drops and larger, irregularly-shaped, melting aggregated snow particles causes a localized <math>\rho_{HV}</math> decrease in this mixed particle regime. The effects of differential phase shift upon backscatter from the large, wet aggregates can also reduce <math>\rho_{HV}</math> <ref name="zrnic">Zrnic, D. S., N. Balakrishnan, C. L. Ziegler, V. N. Bringi, K. Aydin, and T. Matejka. 1993: Polarimetric Signatures in the Stratiform Region of a Mesoscale Convective System. J. Appl. Meteor., 32, pp 678-693</ref>. | |||
In PPI scans through widespread stratifrom precipitation, bright band radar patterns have a roughly circular shape since the melting level is encountered at a fairly constant range on each sweep. Identification of the melting level in PPI data can be improved through the consideration of the polarimetric data fields. The two images below are taken from the the same PPI sweep. The melting level pattern is better defined by the <math>\rho_{HV}</math> minimum than by the reflectivity bright band. | |||
<center> | |||
{| {{Prettytable}} | |||
! {{Hl3}} | Reflectivity contours overlaid on polarimetric color fills | |||
|- | |||
| [[Image:7jun03_rh10.png|frame|<math>\rho_{HV}</math> RHI plot]] | |||
|- | |||
| [[Image:7jun03_ldr.png|frame|LDR RHI plot]] | |||
|- | |||
| [[Image:7jun03_zdr.png|frame|<math>Z_{dr}</math> RHI plot]] | |||
|} | |||
</center> | |||
==VCHILL== | |||
{{Main|[[VCHILL]]}} | {{Main|[[VCHILL]]}} | ||
[http://chill.colostate.edu/java/vchill.php?bookmark=edu:Polarization%20Applications,RhoHV:%20Bright%20Band%20RHI&plot=RhoHV Load example in VCHILL] | [http://chill.colostate.edu/java/vchill.php?bookmark=edu:Polarization%20Applications,RhoHV:%20Bright%20Band%20RHI&plot=RhoHV Load example in VCHILL] | ||
=References= | ==References== | ||
* | <references/> | ||
* | * | ||
* | |||
[[Category:VCHILL Educational Bookmark]] | [[Category:VCHILL Educational Bookmark]] | ||
Latest revision as of 09:45, 23 June 2008
Conceptual Summary
Frozen hydrometeors begin to melt as they fall through the 0°C height level. The first hydrometeors to completely melt are the smaller, less massive particles. The larger particles spend more time in various partially frozen/water-coated states as they melt while descending. Additionally, particle aggregation and breakup also frequently occur at temperatures near 0°C. The net result of these processes often generates distinctive polarimetric signatures. Reflectivity is enhanced as the particles initially develop a wet outer surface, producing the classical "bright band" pattern. With increasing distance below the 0°C level, only the larger sized hydrometeors remain partially frozen. However, due to their large diameters, they strongly influence the polarimetric parameters [1]. These large melting snow particles generally wobble as they fall; on average the orientation of their long axis is more nearly horizontal than vertical.
The large particles thus cause the most positive and the least negative LDR values to be found several hundred meters below the height of the maximum reflectivity. At lower heights, these radar signal peaks fade out as the hydrometeors completely melt into quasi-spherical drops.
| PPI display of Reflectivity and |
|---|

|

|
Examples of these general bright band patterns are shown in the above overlay plots. It is apparent that the and LDR peaks are found somewhat below the maximum reflectivity height. The correlation between the horizontally and vertically polarized return signals () also has a distinct minimum in the vicinity of the melting level. The coexistence of small, completely melted drops and larger, irregularly-shaped, melting aggregated snow particles causes a localized decrease in this mixed particle regime. The effects of differential phase shift upon backscatter from the large, wet aggregates can also reduce [2].
In PPI scans through widespread stratifrom precipitation, bright band radar patterns have a roughly circular shape since the melting level is encountered at a fairly constant range on each sweep. Identification of the melting level in PPI data can be improved through the consideration of the polarimetric data fields. The two images below are taken from the the same PPI sweep. The melting level pattern is better defined by the minimum than by the reflectivity bright band.
| Reflectivity contours overlaid on polarimetric color fills |
|---|
 |
 |
 |
VCHILL
Main article: VCHILL
References
- ↑ Herzegh, P. H. and A. R. Jameson. 1992: Observing Precipitation through Dual-Polarization Radar. Bull. Amer. Meteor. Soc., 73, pp 1365-1374.
- ↑ Zrnic, D. S., N. Balakrishnan, C. L. Ziegler, V. N. Bringi, K. Aydin, and T. Matejka. 1993: Polarimetric Signatures in the Stratiform Region of a Mesoscale Convective System. J. Appl. Meteor., 32, pp 678-693

