Anvil level dual Doppler horizontal winds: 15 June 2012: Difference between revisions
Pat kennedy (talk | contribs) No edit summary |
m (Added dual doppler category link) |
||
| (3 intermediate revisions by one other user not shown) | |||
| Line 1: | Line 1: | ||
[[Image:15jun2012 8.1 deg VR anot.png|300px|right]] | |||
Divergent radial velocity pattern observed in a PPI scan through the anvil level of a thunderstorm during the DC3 project. Example plots of the associated horizontal wind fields obtained from dual Doppler processing of CSU-CHILL and Pawnee radar data have been prepared. | |||
==Introduction== | ==Introduction== | ||
A major research topic in the DC3 project is the transport of various boundary layer atmospheric constituents into the upper troposphere / lower stratosphere by the air motions in thunderstorms. Thunderstorm air flow fields can be synthesized from the radial velocities observed by two or more suitably located Doppler radars. On 15 June 2012 a thunderstorm was observed over the Rocky Mountains in the western dual Doppler lobe defined by the CSU-CHILL and Pawnee radars. This article presents some preliminary observations of this storm. | A major research topic in the DC3 project (Deep Convective Clouds and Chemistry Experiment) is the transport of various boundary layer atmospheric constituents into the upper troposphere / lower stratosphere by the air motions in thunderstorms. Thunderstorm air flow fields can be synthesized from the radial velocities observed by two or more suitably located Doppler radars. On 15 June 2012 a thunderstorm was observed over the Rocky Mountains in the western dual Doppler lobe defined by the CSU-CHILL and Pawnee radars. This article presents some preliminary observations of this storm. | ||
==Horizontal airflow at 11.5 km MSL== | ==Horizontal airflow at 11.5 km MSL== | ||
The CSU-CHILL and Pawnee radars started multi-sweep PPI sector scans of the western lobe at 1740 UTC. Ground clutter due to the underlying elevated terrain compromised the data at the lowest elevation angles; at higher elevation angles the storm was well observed by both radars. The data were processed using NCAR software: Each radar's observations were interpolated to a common Cartesian grid using SPRINT; horizontal air motions were derived from the gridded radial velocities using CEDRIC. The following plot shows the Earth-relative horizontal winds in the storm's anvil at 11.5 km MSL. The ambient flow is diverted around the reflectivity maximum near the southwestern end of the echo system. This pattern is due to the lower-momentum air that the updraft is raising to the anvil height level. | The CSU-CHILL and Pawnee radars started multi-sweep PPI sector scans of the western lobe at 1740 UTC. Ground clutter due to the underlying elevated terrain compromised the data at the lowest elevation angles; at higher elevation angles the storm was well observed by both radars. The data were processed using NCAR software: Each radar's observations were interpolated to a common Cartesian grid using SPRINT; horizontal air motions were derived from the gridded radial velocities using CEDRIC. (The X and Y axes are km distances from the grid origin at the CSU-CHILL radar). The following plot shows the Earth-relative horizontal winds in the storm's anvil at 11.5 km MSL. The ambient flow is diverted around the reflectivity maximum near the southwestern end of the echo system. This pattern is due to the lower-momentum air that the updraft is raising to the anvil height level. | ||
[[Image:15jun2012 dd z anot.png|center]] | [[Image:15jun2012 dd z anot.png|center]] | ||
| Line 13: | Line 20: | ||
==RHI data== | ==RHI data== | ||
An RHI scan through the southern portion of the storm was done on an azimuth of 278 degrees just before the time of the dual Doppler analysis shown above. The echo summit | An RHI scan through the southern portion of the storm was done on an azimuth of 278 degrees just before the time of the dual Doppler analysis shown above. The echo summit reached ~12 km AGL (13.4 km MSL) near a range of 75 km. | ||
[[Image:15jun2012 1739 Z rhi anot.png|center]] | [[Image:15jun2012 1739 Z rhi anot.png|center]] | ||
| Line 20: | Line 27: | ||
The radial velocity pattern in the RHI plane shows the divergent pattern in the echo summit region where the updraft decelerates as it encounters an increasingly stable environment at the tropopause. The overall upper level divergence / lower level convergence pattern contained in the RHI scan indicates that the deep upward motions in the storm were capable of carrying boundary layer air into the upper troposphere. | The radial velocity pattern in the RHI plane shows the divergent pattern in the echo summit region where the updraft decelerates as it encounters an increasingly stable environment at the tropopause. The overall upper level divergence / lower level convergence pattern contained in the RHI scan indicates that the deep upward motions in the storm were capable of carrying boundary layer air into the upper troposphere. | ||
[[Image: | [[Image:Anot png.1120615173857.CSU-CHIL.0 278.0 RHI VT.png|center]] | ||
==LMA data== | ==LMA data== | ||
Lightning Mapping Array (LMA) data for the 1740 - 1750 UTC time period is shown in the next plot. Despite the storm's modest intensity, it generated a number of lightning discharges in central Larimer County. The high temperatures associated with these lightning channels cause the formation of various Nitrogen oxides, etc. | Lightning Mapping Array (LMA) data for the 1740 - 1750 UTC time period is shown in the next plot. Despite the storm's modest intensity at this time, it generated a number of lightning discharges in central Larimer County. The high temperatures associated with these lightning channels cause the formation of various Nitrogen oxides, etc. | ||
[[Image:LMA points anot 650.png|center]] | [[Image:LMA points anot 650.png|center]] | ||
==Summary== | ==Summary== | ||
The three dimensional airflows in thunderstorms provide a significant conduit for air exchanges between boundary layer and upper troposphere levels. During its passage through thunderstorms, air from the boundary layer is subjected to complex interactions with both liquid water and ice particles as well co-mingling with | The three dimensional airflows in thunderstorms provide a significant conduit for air exchanges between the boundary layer and upper troposphere levels. During its passage through thunderstorms, air from the boundary layer is subjected to complex interactions with both liquid water and ice particles as well co-mingling with various lightning-generated compounds. Data obtained from dual Doppler wind fields in combination with the LMA lightning mapping information are critical to achieving the DC3 project's science objectives. | ||
[[Category:CHILL PAW dual Doppler]] | |||
[[Category:Featured Articles]] | |||
[[Category:Dual Doppler]] | |||
Latest revision as of 13:04, 27 May 2015
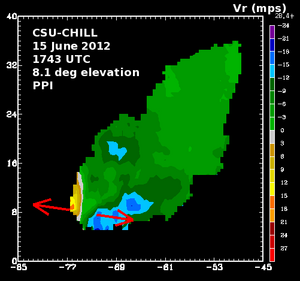
Divergent radial velocity pattern observed in a PPI scan through the anvil level of a thunderstorm during the DC3 project. Example plots of the associated horizontal wind fields obtained from dual Doppler processing of CSU-CHILL and Pawnee radar data have been prepared.
Introduction
A major research topic in the DC3 project (Deep Convective Clouds and Chemistry Experiment) is the transport of various boundary layer atmospheric constituents into the upper troposphere / lower stratosphere by the air motions in thunderstorms. Thunderstorm air flow fields can be synthesized from the radial velocities observed by two or more suitably located Doppler radars. On 15 June 2012 a thunderstorm was observed over the Rocky Mountains in the western dual Doppler lobe defined by the CSU-CHILL and Pawnee radars. This article presents some preliminary observations of this storm.
Horizontal airflow at 11.5 km MSL
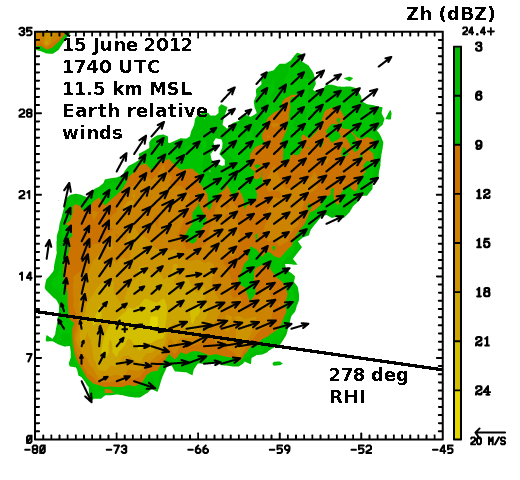
The CSU-CHILL and Pawnee radars started multi-sweep PPI sector scans of the western lobe at 1740 UTC. Ground clutter due to the underlying elevated terrain compromised the data at the lowest elevation angles; at higher elevation angles the storm was well observed by both radars. The data were processed using NCAR software: Each radar's observations were interpolated to a common Cartesian grid using SPRINT; horizontal air motions were derived from the gridded radial velocities using CEDRIC. (The X and Y axes are km distances from the grid origin at the CSU-CHILL radar). The following plot shows the Earth-relative horizontal winds in the storm's anvil at 11.5 km MSL. The ambient flow is diverted around the reflectivity maximum near the southwestern end of the echo system. This pattern is due to the lower-momentum air that the updraft is raising to the anvil height level.
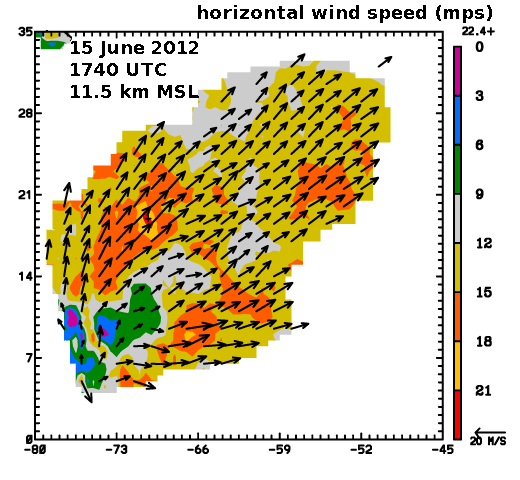
The color fill in the following plot is the magnitude of the horizontal wind at 11.5 km MSL based on the U and V components from the dual Doppler synthesis. The locally accelerated flow around the flanks of the echo core / updraft region are evident.
RHI data
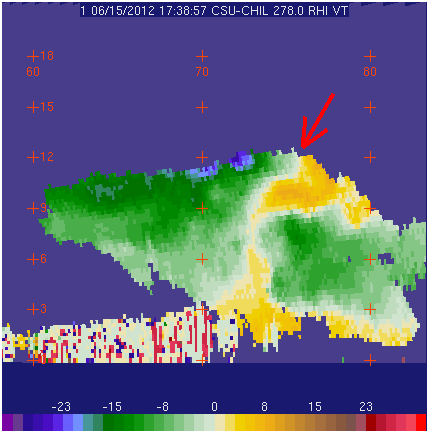
An RHI scan through the southern portion of the storm was done on an azimuth of 278 degrees just before the time of the dual Doppler analysis shown above. The echo summit reached ~12 km AGL (13.4 km MSL) near a range of 75 km.
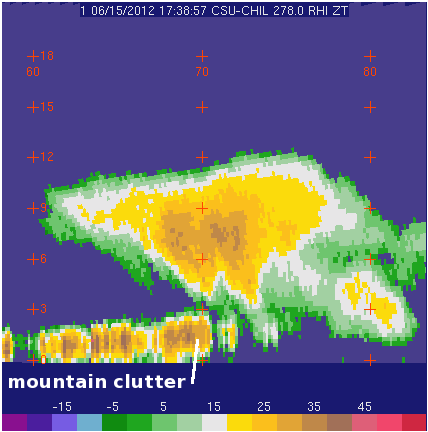
The radial velocity pattern in the RHI plane shows the divergent pattern in the echo summit region where the updraft decelerates as it encounters an increasingly stable environment at the tropopause. The overall upper level divergence / lower level convergence pattern contained in the RHI scan indicates that the deep upward motions in the storm were capable of carrying boundary layer air into the upper troposphere.
LMA data
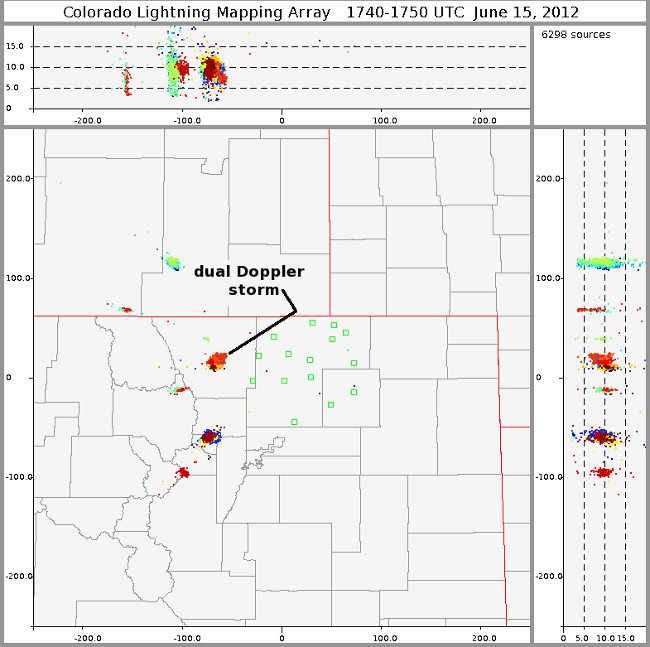
Lightning Mapping Array (LMA) data for the 1740 - 1750 UTC time period is shown in the next plot. Despite the storm's modest intensity at this time, it generated a number of lightning discharges in central Larimer County. The high temperatures associated with these lightning channels cause the formation of various Nitrogen oxides, etc.
Summary
The three dimensional airflows in thunderstorms provide a significant conduit for air exchanges between the boundary layer and upper troposphere levels. During its passage through thunderstorms, air from the boundary layer is subjected to complex interactions with both liquid water and ice particles as well co-mingling with various lightning-generated compounds. Data obtained from dual Doppler wind fields in combination with the LMA lightning mapping information are critical to achieving the DC3 project's science objectives.