A comparison of dual polarization KFTG and CSU-CHILL Kdp fields: 26 September 2012: Difference between revisions
Pat kennedy (talk | contribs) (initial posting) |
Pat kennedy (talk | contribs) (authors added) |
||
| (4 intermediate revisions by 2 users not shown) | |||
| Line 1: | Line 1: | ||
Authors: P. C. Kennedy and V. Chandrasekar | |||
[[Image:Pville 26sept2012 CHL 1.8el Z anot.png|300px|right]] | |||
CSU-CHILL reflectivity data collected as a severe thunderstorm passed the Platteville, Colorado area during the afternoon hours of 26 September, 2012. The National Weather Service Denver/Front Range (KFTG) radar was also collecting dual polarization data from this same storm. Comparative plots of the specific propagation differential phase (<math>K_{dp}</math>) data from the CSU-CHILL and KFTG radars have been prepared. | |||
==Introduction== | ==Introduction== | ||
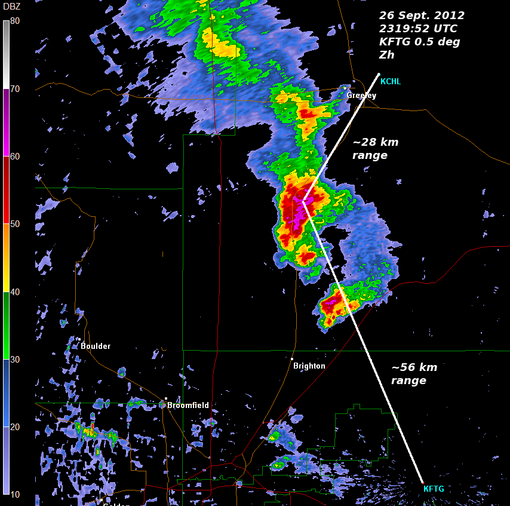
The Denver / Front Range WSR-88D radar began operations in dual polarization configuration on 5 September 2012. One of the first opportunities for KFTG to collect dual polarization data in severe convection occurred on 26 September when thunderstorms producing locally heavy rain and small hail developed in the area. The CSU-CHILL radar was also operating on the afternoon of the 26th. CSU-CHILL was operating in alternating H,V transmission mode at a significantly slower azimuthal scan rate (~8 deg / sec). Due to the difference in scan rates, CSU-CHILL used PPI sector scans to allow more sweeps to be completed within the ~4 minute duration KFTG volumes. Periodically, the CSU-CHILL volumes were manually started in an effort to attain time synchronization with KFTG. The following plots were made from volumes scans that KFTG started at 2319:52 UTC and CSU-CHILL started at 2319:32 UTC. The following plot shows the KFTG reflectivity field at the 0.5 deg elevation angle. The storm of interest was located just northeast of Platteville at this time. | The Denver/Front Range WSR-88D radar began operations in dual polarization configuration on 5 September 2012. One of the first opportunities for KFTG to collect dual polarization data in severe convection occurred on 26 September when thunderstorms producing locally heavy rain and small hail developed in the area. The CSU-CHILL radar was also operating on the afternoon of the 26th. CSU-CHILL was operating in alternating H,V transmission mode at a significantly slower azimuthal scan rate (~8 deg/sec). Due to the difference in scan rates, CSU-CHILL used PPI sector scans to allow more sweeps to be completed within the ~4 minute duration KFTG volumes. Periodically, the CSU-CHILL volumes were manually started in an effort to attain time synchronization with KFTG. The following plots were made from volumes scans that KFTG started at 2319:52 UTC and CSU-CHILL started at 2319:32 UTC. The following plot shows the KFTG reflectivity field at the 0.5° elevation angle. The storm of interest was located just northeast of Platteville at this time. | ||
[[Image:KFTG colors radar anot3.png|510px|center]] | [[Image:KFTG colors radar anot3.png|510px|center]] | ||
==KFTG data== | ==KFTG data== | ||
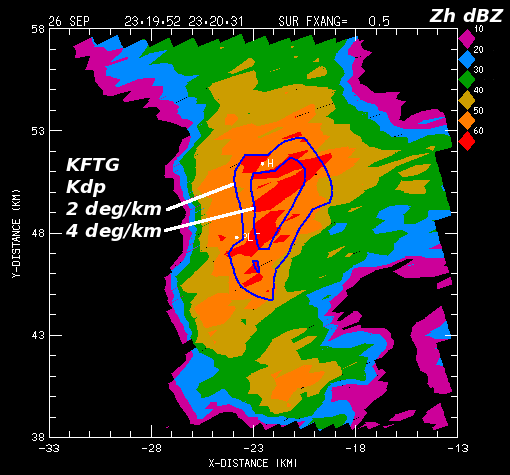
The level II KFTG data for this event was obtained from the National Climatic Data Center (NCDC). Specific differential propagation phase ( | The level II KFTG data for this event was obtained from the National Climatic Data Center (NCDC). Specific differential propagation phase (<math>K_{dp}</math>) was calculated from the basic propagation differential phase (PH) data in the level II file using the methods of Wang and Chandrasekar (JTECH, Dec, 2009). In the following plot, the KFTG <math>K_{dp}</math> values are shown as solid contours overlaid on a color fill depiction of the reflectivity field. "PLT" indicates the location of the town of Platteville. <math>K_{dp}</math> values exceeding 4 deg/km (implying rain rates of ~130 mm/hr) were present in the area immediately northeast of Platteville. Public reports of localized flooding and sub-severe (less than 1 inch diameter) hail were received from Platteville. (Near 0 dB <math>Z_{dr}</math> values indicative of hail were present in the CSU-CHILL data at the "H" location ~5 km north of PLT). | ||
[[Image:26sept2012 KFTG kdp anot.png|center]] | [[Image:26sept2012 KFTG kdp anot.png|center]] | ||
==CSU-CHILL PPI data== | ==CSU-CHILL PPI data== | ||
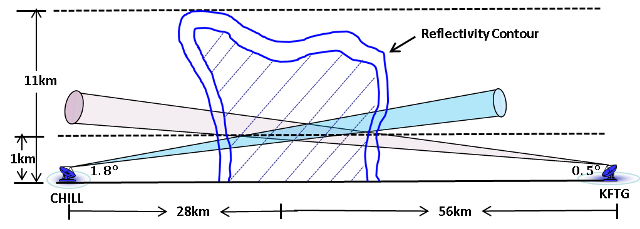
The center of the KFTG beam was at a height of ~2.35 km MSL in the high | The center of the KFTG beam was at a height of ~2.35 km MSL in the high <math>K_{dp}</math> area. Due to the closer range and lower radar site elevation above sea level (1.42 km vs. 1.68 km), an elevation angle of 1.8 degrees was required to observe the ~2.35 km height level from the CSU-CHILL radar. A depiction of the geometry of these two different elevation angles is shown in the following schematic vertical cross-section. | ||
[[Image:CHILL KFTG observation cartoon 1 640w.png|center]] | |||
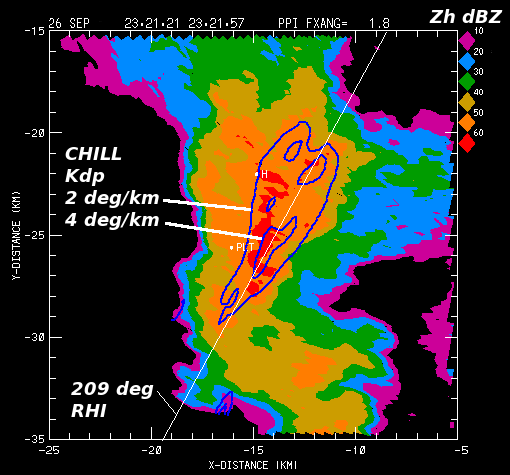
The next plot shows the overlaid <math>K_{dp}</math>/reflectivity color plot of the CSU-CHILL data at the 1.8 deg elevation angle. Due to the shorter range and lower side lobe level antenna, smaller scale features are present in the CSU-CHILL <math>K_{dp}</math> field. The general <math>K_{dp}</math> magnitudes observed by KFTG and CSU-CHILL are in reasonably good agreement. | |||
[[Image:26sept2012 CHL 1.8el kdp anot2.png|center]] | [[Image:26sept2012 CHL 1.8el kdp anot2.png|center]] | ||
==CSU-CHILL RHI data== | ==CSU-CHILL RHI data== | ||
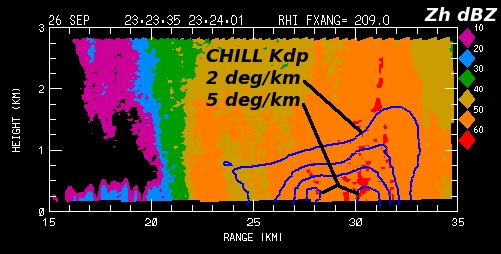
Shortly after the PPI scans shown above, an RHI scan was done by the CSU-CHILL radar on the 209 deg azimuth to observe the vertical structure of the high | Shortly after the PPI scans shown above, an RHI scan was done by the CSU-CHILL radar on the 209 deg azimuth to observe the vertical structure of the high <math>K_{dp}</math> area. As shown in the following plot, the <math>K_{dp}</math> magnitudes increased significantly within ~1 km of the ground. This was probably the result of enhanced drop production from hailstones that were both shedding liquid and/or completely melting. | ||
[[Image:26sept2012 RHI 2323 Kdp anot.png|center]] | [[Image:26sept2012 RHI 2323 Kdp anot.png|center]] | ||
==Summary== | ==Summary== | ||
<math>K_{dp}</math> data is critical in the development of accurate rain rate estimates when mixtures of rain and hail are present. Based on this simple "snapshot" examination, fairly good agreement was found between the <math>K_{dp}</math> values observed by the operational KFTG radar and the CSU-CHILL research radar. | |||
==References== | |||
* Wang, Yanting, V. Chandrasekar, 2009: [http://dx.doi.org/10.1175/2009JTECHA1358.1 Algorithm for Estimation of the Specific Differential Phase] Journal of Atmospheric and Oceanic Technology, '''26''', pp. 2565–2578 | |||
* [http://hurricane.ncdc.noaa.gov/pls/plhas/HAS.FileAppSelect?datasetname=6500 HDSS Access System] for Nexrad Level II data used in this article | |||
[[Category:Featured Articles]] | |||
[[Category:Severe Thunderstorm]] | |||
[[Category:Differential Propagation Phase]] | |||
[[Category:Heavy Rain]] | |||
Latest revision as of 12:42, 6 December 2012
Authors: P. C. Kennedy and V. Chandrasekar
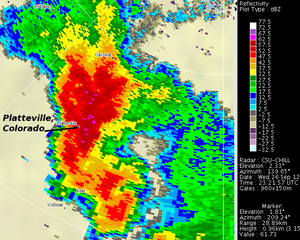
CSU-CHILL reflectivity data collected as a severe thunderstorm passed the Platteville, Colorado area during the afternoon hours of 26 September, 2012. The National Weather Service Denver/Front Range (KFTG) radar was also collecting dual polarization data from this same storm. Comparative plots of the specific propagation differential phase () data from the CSU-CHILL and KFTG radars have been prepared.
Introduction
The Denver/Front Range WSR-88D radar began operations in dual polarization configuration on 5 September 2012. One of the first opportunities for KFTG to collect dual polarization data in severe convection occurred on 26 September when thunderstorms producing locally heavy rain and small hail developed in the area. The CSU-CHILL radar was also operating on the afternoon of the 26th. CSU-CHILL was operating in alternating H,V transmission mode at a significantly slower azimuthal scan rate (~8 deg/sec). Due to the difference in scan rates, CSU-CHILL used PPI sector scans to allow more sweeps to be completed within the ~4 minute duration KFTG volumes. Periodically, the CSU-CHILL volumes were manually started in an effort to attain time synchronization with KFTG. The following plots were made from volumes scans that KFTG started at 2319:52 UTC and CSU-CHILL started at 2319:32 UTC. The following plot shows the KFTG reflectivity field at the 0.5° elevation angle. The storm of interest was located just northeast of Platteville at this time.
KFTG data
The level II KFTG data for this event was obtained from the National Climatic Data Center (NCDC). Specific differential propagation phase () was calculated from the basic propagation differential phase (PH) data in the level II file using the methods of Wang and Chandrasekar (JTECH, Dec, 2009). In the following plot, the KFTG values are shown as solid contours overlaid on a color fill depiction of the reflectivity field. "PLT" indicates the location of the town of Platteville. values exceeding 4 deg/km (implying rain rates of ~130 mm/hr) were present in the area immediately northeast of Platteville. Public reports of localized flooding and sub-severe (less than 1 inch diameter) hail were received from Platteville. (Near 0 dB values indicative of hail were present in the CSU-CHILL data at the "H" location ~5 km north of PLT).
CSU-CHILL PPI data
The center of the KFTG beam was at a height of ~2.35 km MSL in the high area. Due to the closer range and lower radar site elevation above sea level (1.42 km vs. 1.68 km), an elevation angle of 1.8 degrees was required to observe the ~2.35 km height level from the CSU-CHILL radar. A depiction of the geometry of these two different elevation angles is shown in the following schematic vertical cross-section.
The next plot shows the overlaid /reflectivity color plot of the CSU-CHILL data at the 1.8 deg elevation angle. Due to the shorter range and lower side lobe level antenna, smaller scale features are present in the CSU-CHILL field. The general magnitudes observed by KFTG and CSU-CHILL are in reasonably good agreement.
CSU-CHILL RHI data
Shortly after the PPI scans shown above, an RHI scan was done by the CSU-CHILL radar on the 209 deg azimuth to observe the vertical structure of the high area. As shown in the following plot, the magnitudes increased significantly within ~1 km of the ground. This was probably the result of enhanced drop production from hailstones that were both shedding liquid and/or completely melting.
Summary
data is critical in the development of accurate rain rate estimates when mixtures of rain and hail are present. Based on this simple "snapshot" examination, fairly good agreement was found between the values observed by the operational KFTG radar and the CSU-CHILL research radar.
References
- Wang, Yanting, V. Chandrasekar, 2009: Algorithm for Estimation of the Specific Differential Phase Journal of Atmospheric and Oceanic Technology, 26, pp. 2565–2578
- HDSS Access System for Nexrad Level II data used in this article

