NWS Warning Overview
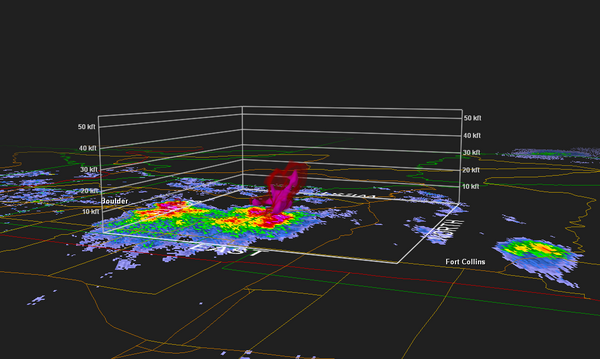
Meeting held at BOU with Eric on 7 September 2011. A replay of KFTG data and products (VIL, etc.) was done. Suspicions that storm needed a warning probably were developing during the 0104:43 volume; the decision to issue the warning was made during the 0109:21 KFTG volume. The following 3D GRAnalyst plot shows the 53-55 dBZ surface (semi-transparent), and the 60 dBZ syrface (solid purple) in the KFTG 0109:21 (warning issuance) volume:
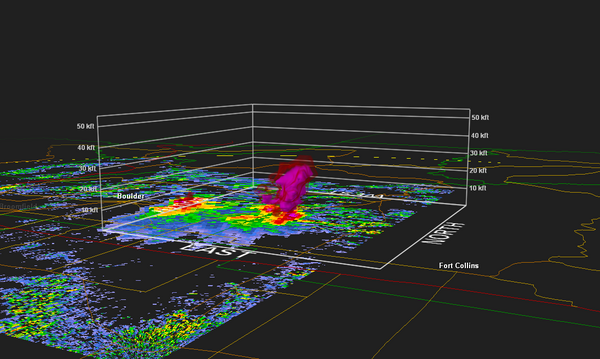
The next plot is a similar image generated from the CHILL 0109:49 volume:
NWS Training on dual-pol hail detection
From module presented on the web, two primary areas of interest are where the PPI sweep intersects the environmental 0C and -20C levels. Basic storm structure is diagnosed using conventional reflectivity and radial velocity fields. Polarimetric moments of interest are Zdr, rhoHV and Kdp. (No mention made of Hydrometeor Classification Algorithm (HCA) products).
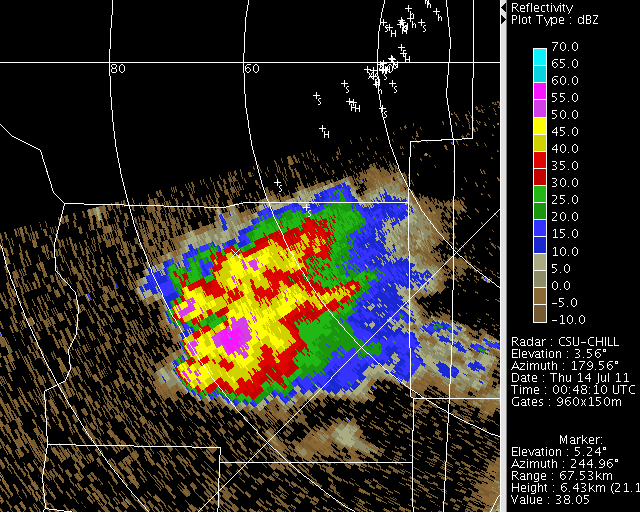
PPI loops during the warning decision-making phase
Reflectivity loop near 0C sounding temp level. The VCHILL base map symbols are: (h) non-severe hail diameter CoCoRaHS report; (H) severe (1 inch or larger) CoCoRaHS report; S=SPC/NCDC severe-class hail report.
|
Click play to begin animation |
|
|
|
|
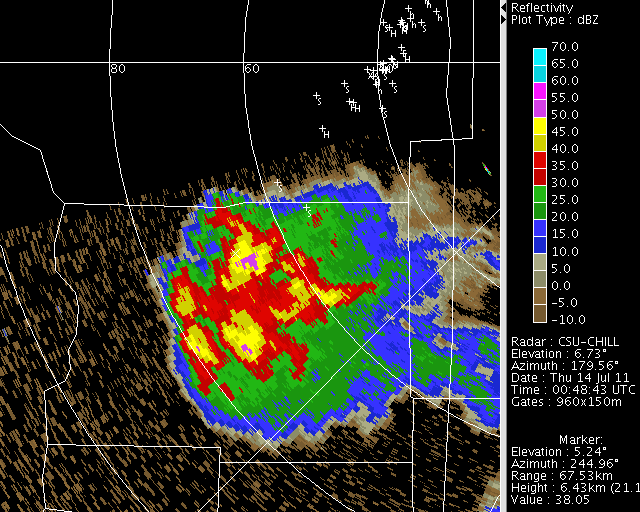
Reflectivity loop near -20C sounding temp level.
|
Click play to begin animation |
|
|
|
|
|
Click play to begin animation |
|
|
|
|
|
Click play to begin animation |
|
|
|
|
|
Click play to begin animation |
|
|
|
|
|
Click play to begin animation |
|
|
|
|
|
Click play to begin animation |
|
|
|
|
|
Click play to begin animation |
|
|
|
|
|
Click play to begin animation |
|
|
|
|
|
Click play to begin animation |
|
|
|
|
|
Click play to begin animation |
|
|
|
|
|
Click play to begin animation |
|
|
|
|
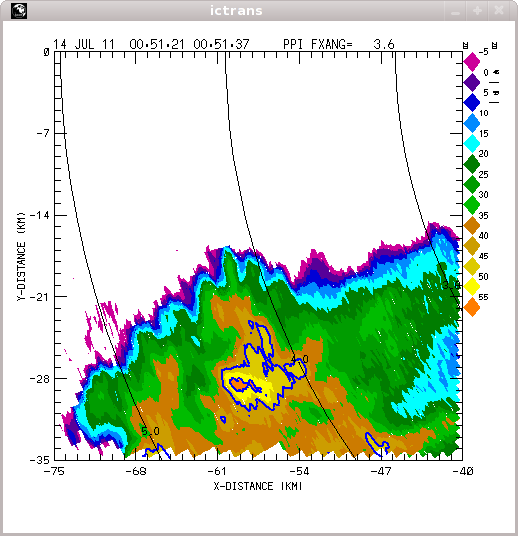
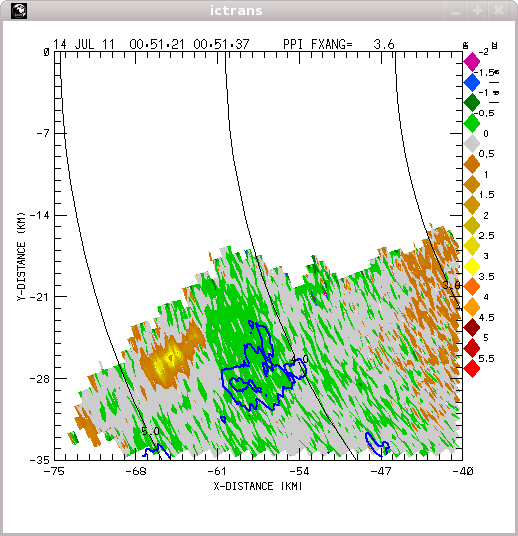
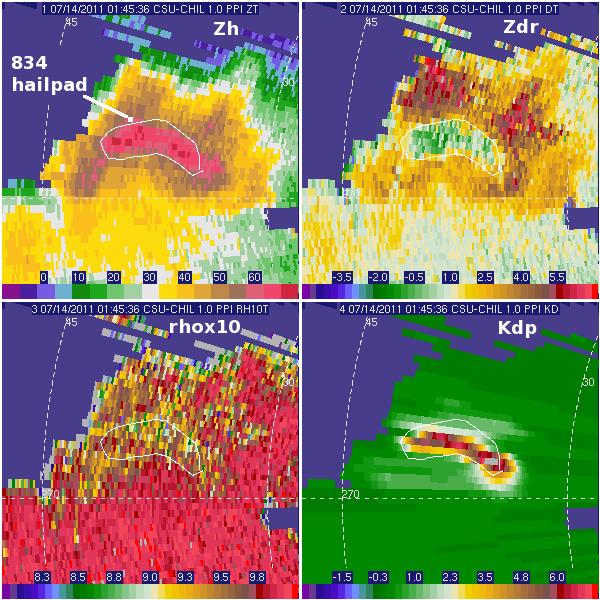
3.6 degree PPI plots with Zh contour overlay
All plots include 3 height rings at 3, 4, and 5 km AGL. (The CHILL site elevation is 1.4 km MSL). The 45, 55, and 65 dBZ reflectivity levels are shown as solid line contour overlays on each plot.
Reflectivity:
The echo core associated with the Ft. Collins hailstorm starts to become evident at 0057. The three-body scattering signature appears shortly there after.
|
Click play to begin animation |
|
|
|
|
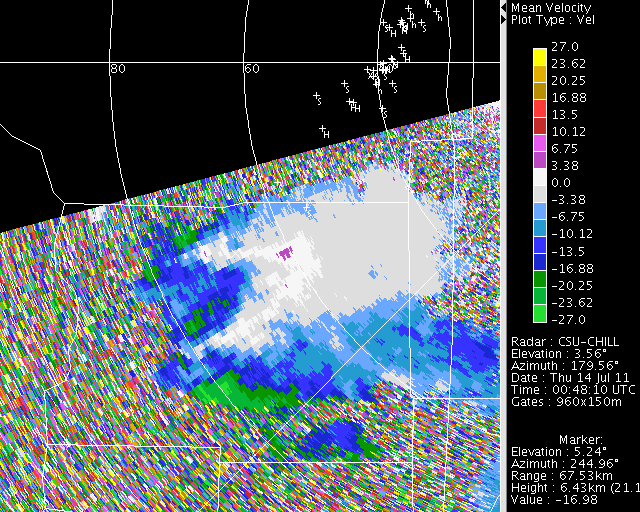
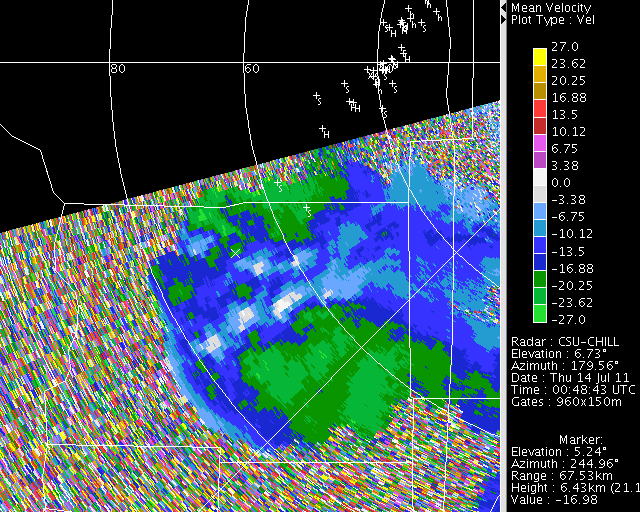
Radial velocity (mps):
Positive velocities associated with the undiluted momentum of the low level air being carried up to the PPI level in the developing updraft are apparent. The environmental airflow is seen to accelerate around the sides of the updraft. (See also the dual-Doppler plots located further down the page).
|
Click play to begin animation |
|
|
|
|
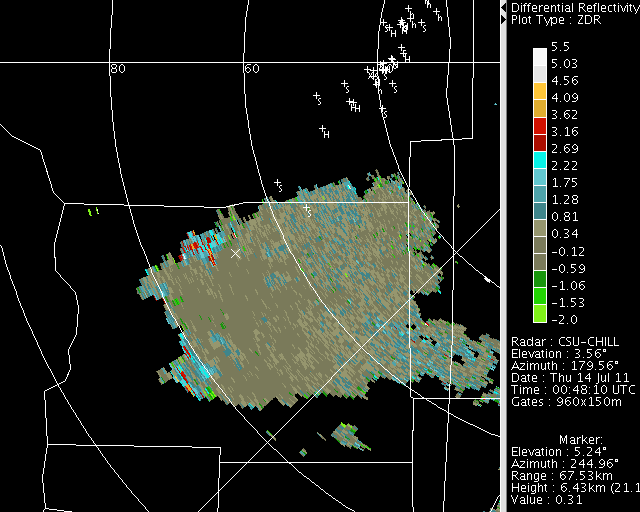
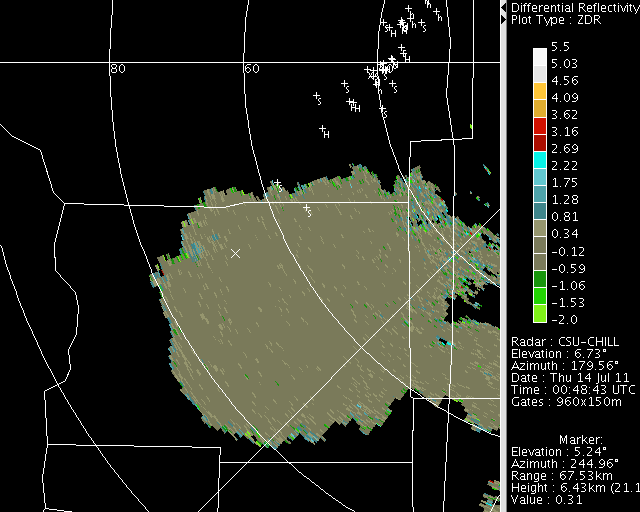
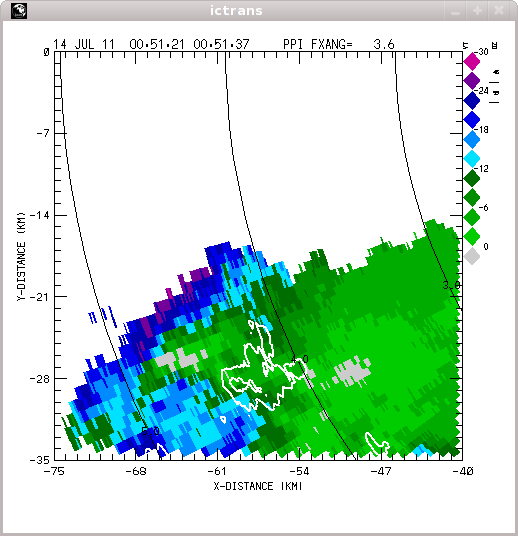
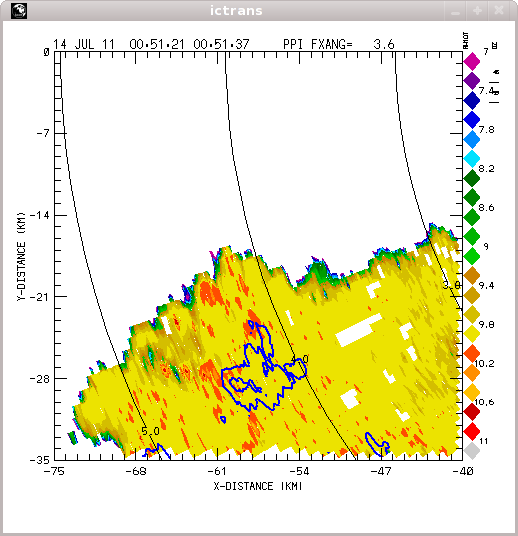
Differential reflectivity (Zdr):
A positive Zdr column exists before the intense core reflectivities appear. Zdr anomalies are also evident in the three body echo.
|
Click play to begin animation |
|
|
|
|
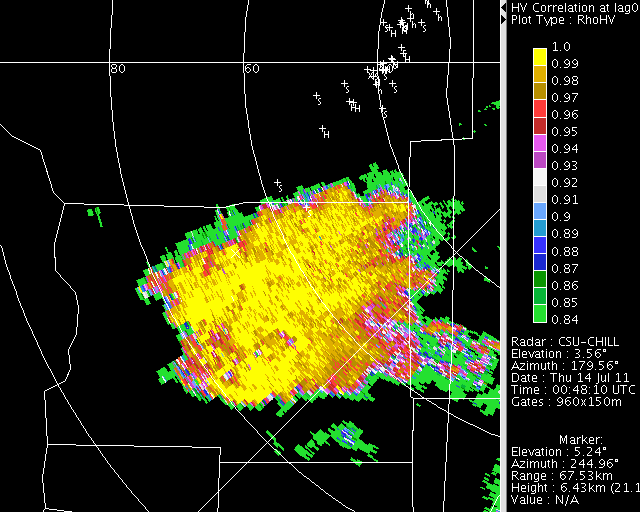
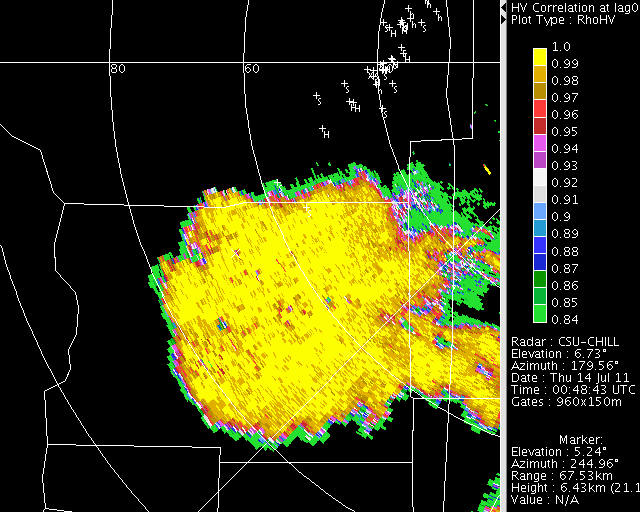
H V correlation (rhoHV or NWS "cross correlation"):
A localized RhoHV minimum is found in the early core development stages. A deeper minimum appears presumably as larger hail diameters reach / develop at the PPI height.
|
Click play to begin animation |
|
|
|
|
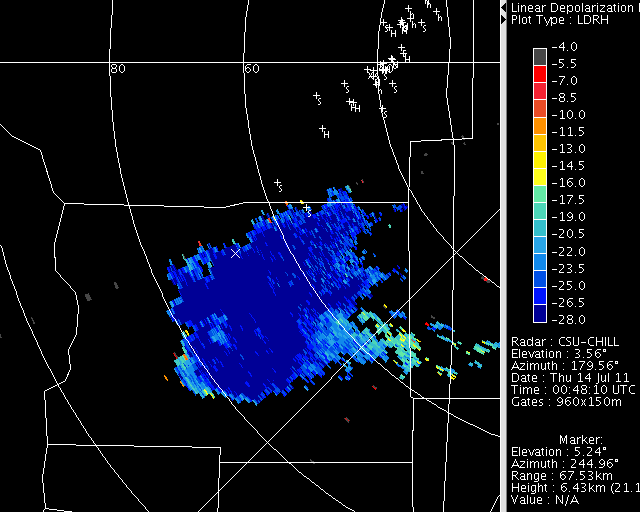
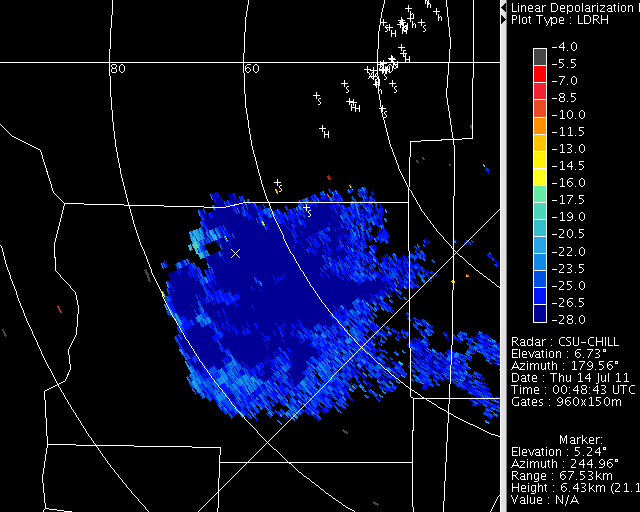
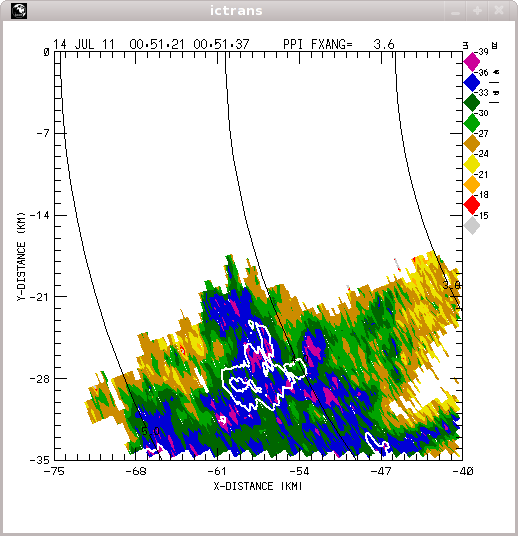
Linear depolarization ratio (Ldr):
In agreement with theory, Ldr enhancement pattern generally follows the rhoHV reductions. By the final time, high depolarization levels (above -18 dB) appear in the echo core apparently at the "root" of the three body echo.
|
Click play to begin animation |
|
|
|
|
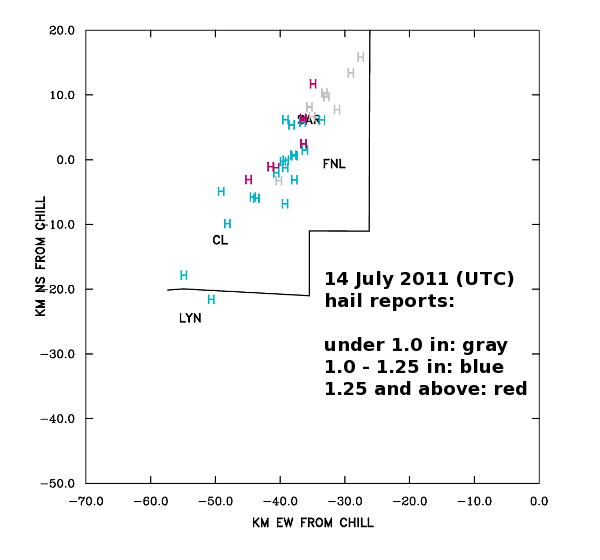
Spotter observations and NLDN data
Spotter confirmation of severe hail production took place primarily after the storm crossed into Larimer County. The CG lightning polarity also became predominately positive during this portion of the storm's history:
|
Click play to begin animation |
|
|
|
|
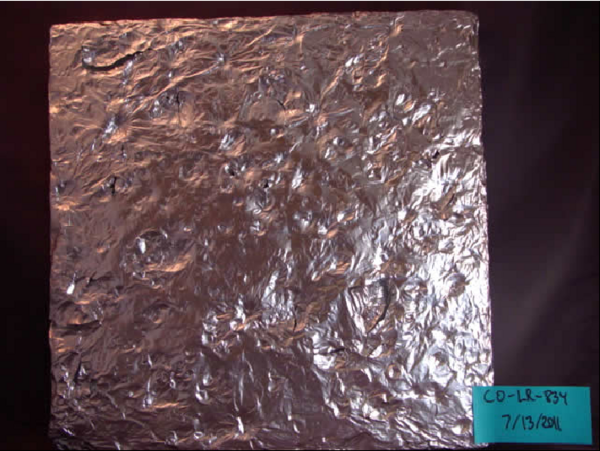
Surface verification of polarimetric signatures
(Low level polarimetric patterns are also emphasized in the NWS training materials).
Hail impacts between 0140 and 0147 UTC; largest diameter=1.25 inches; leaves shredded.
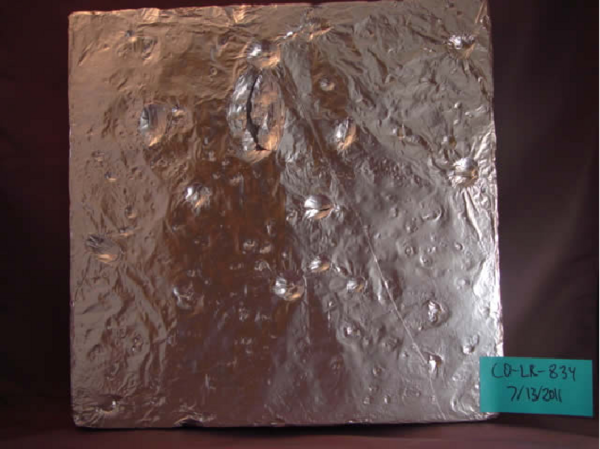
Hail impacts after pad change. Pad exposure time reported as 0147 - 0150 UTC. Impacts still sufficient to tear foil.
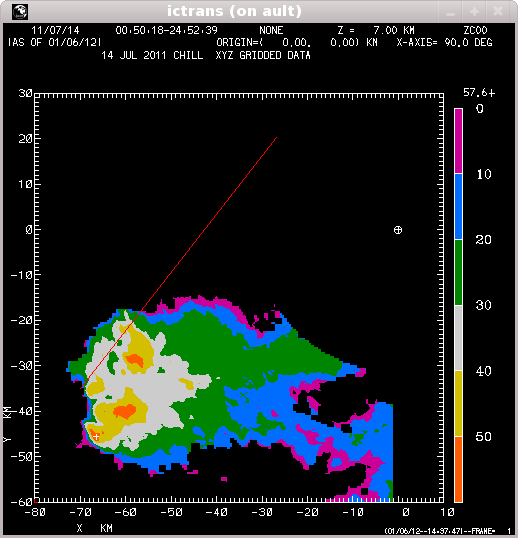
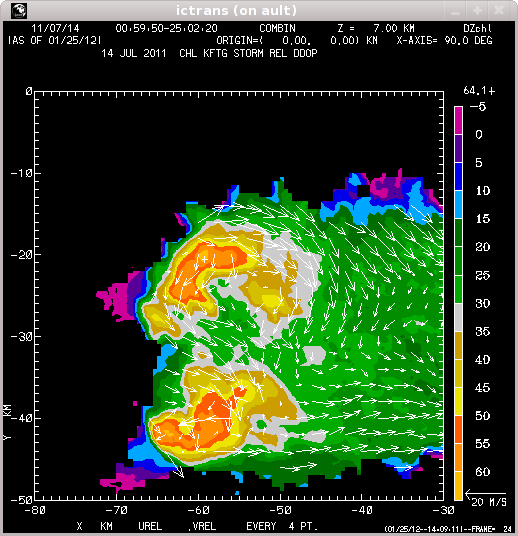
CAPPI plots: 7km MSL reflectivity
Based on the 00 UTC DNR sounding on 14 July, the ambient temperature at 7 km MSL was approx -11 C; the moist adiabatic temperature at this level was ~ -5 C. The following sequence of plots extends beyond the VCHILL PPI sequences shown earlier. (Those were directed primarily at the period leading up to the NWS warning issuance). During the CAPPI plot period, the echo core of interest tracked along an essentially straight line path. The red line in the CAPPI plots is located along this core motion track.
|
Click play to begin animation |
|
|
|
|
KFTG - CHILL dual-Doppler plots
KFTG and CHILL happened to fall into reasonably good (within ~30 sec) volume start synch at 0100 and 0109 UTC.
Storm-relative horizontal flow field at 7 km MSL (like the above CAPPI series) shows obstacle flow; appears to be stronger and most evident on the northern flank of the storm where sense of the turning is anti-cyclonic.
|
Click play to begin animation |
|
|
|
|
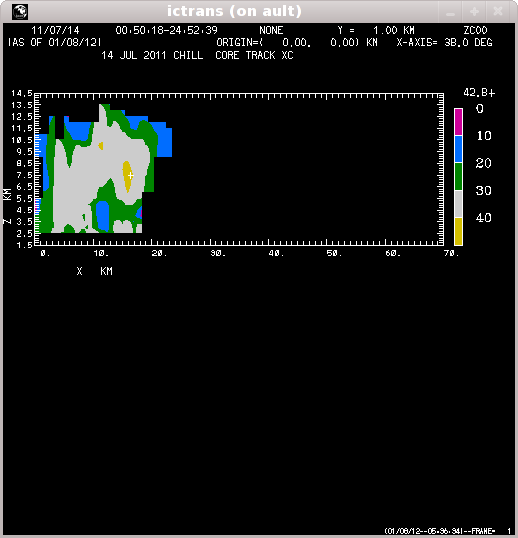
Rotated vertical XC plots: reflectivity
The following vertical cross-sections were located along the red line shown in the CAPPI plots using the CEDRIC REMAP procedure. It appears that the vertical structure of the storm may have been sampled well enough to support hydrometeor identification processing.
|
Click play to begin animation |
|
|
|
|
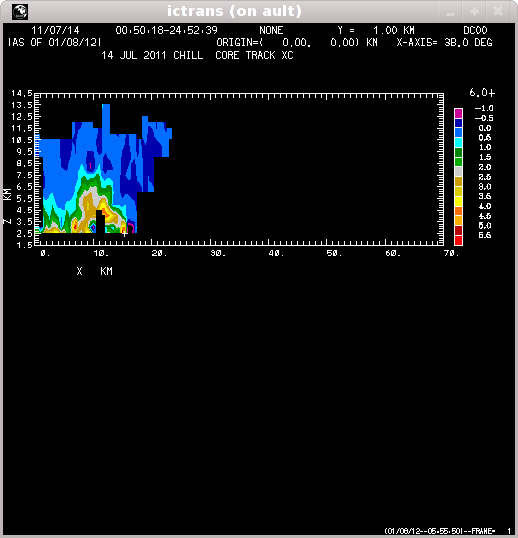
Rotated vertical XC plots: Zdr
The next series of plots shows the Zdr field in the same vertical cross section. The development of a hail signature reaching the surface can be seen.
|
Click play to begin animation |
|
|
|
|


