NWS Warning Overview
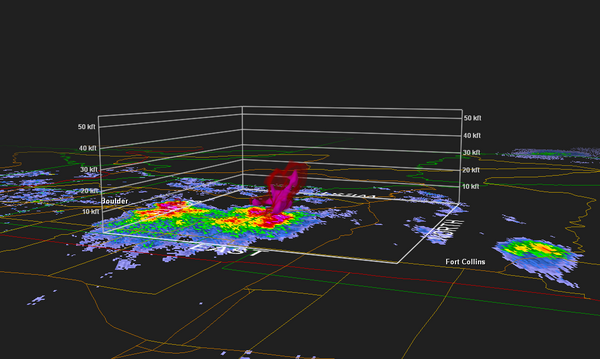
Meeting held at BOU with Eric on 7 September 2011. A replay of KFTG data and products (VIL, etc.) was done. Suspicions that storm needed a warning probably were developing during the 0104:43 volume; the decision to issue the warning was made during the 0109:21 KFTG volume. The following 3D GRAnalyst plot shows the 53-55 dBZ surface (semi-transparent), and the 60 dBZ syrface (solid purple) in the KFTG 0109:21 (warning issuance) volume:
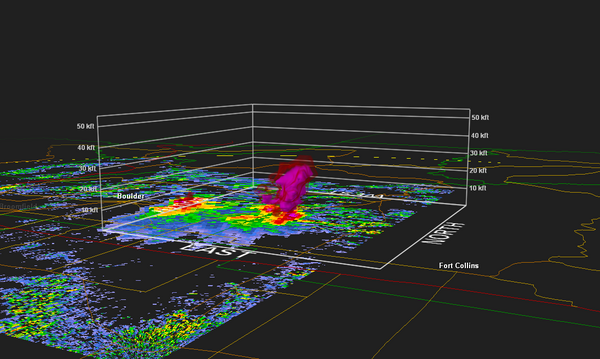
The next plot is a similar image generated from the CHILL 0109:49 volume:
NWS Training on dual-pol hail detection
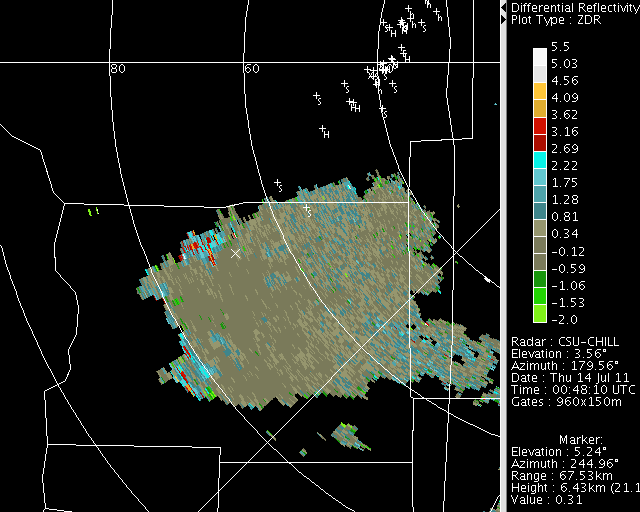
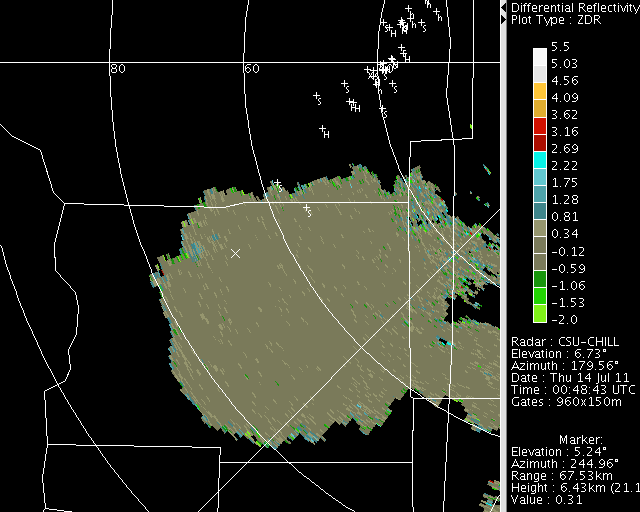
From module presented on the web, two primary areas of interest are where the PPI sweep intersects the environmental 0C and -20C levels. Basic storm structure is diagnosed using conventional reflectivity and radial velocity fields. Polarimetric moments of interest are Zdr, rhoHV and Kdp. (No mention made of Hydrometeor Classification Algorithm (HCA) products).
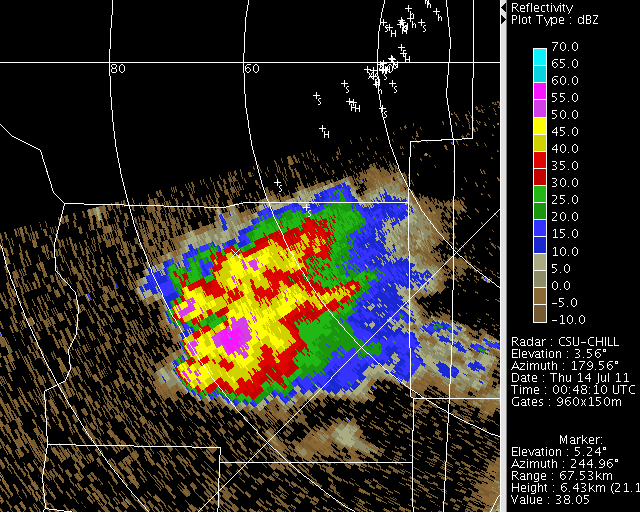
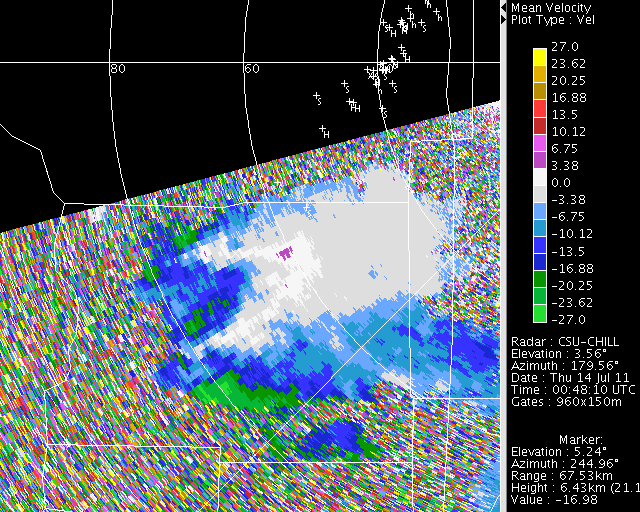
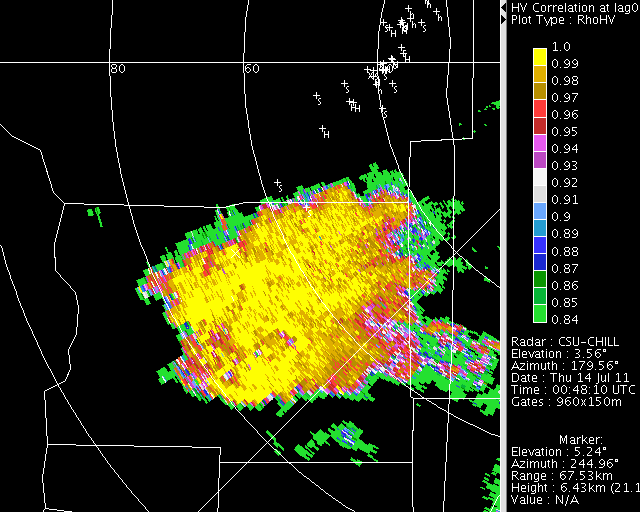
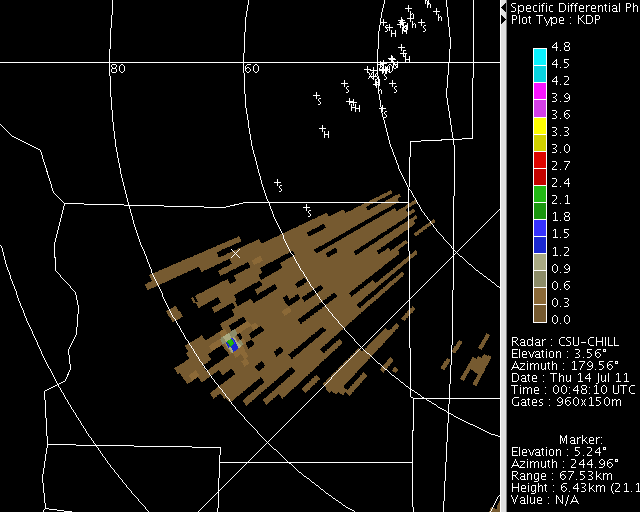
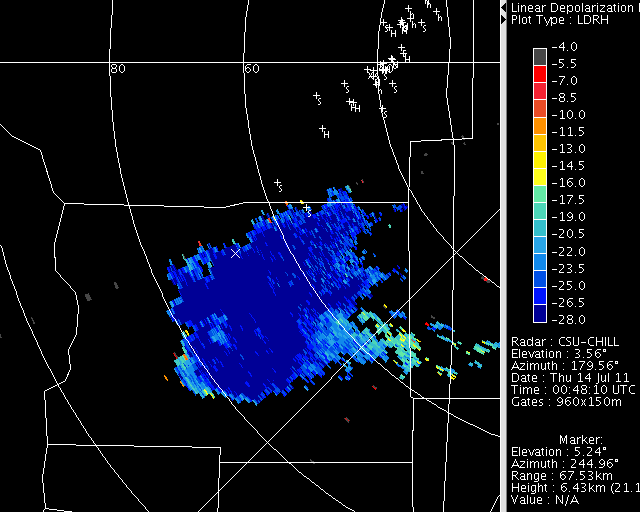
PPI loops during the warning decision-making phase
Reflectivity loop near 0C sounding temp level. The VCHILL base map symbols are: (h) non-severe hail diameter CoCoRaHS report; (H) severe (1 inch or larger) CoCoRaHS report; S=SPC/NCDC severe-class hail report.
|
Click play to begin animation |
|
|
|
|
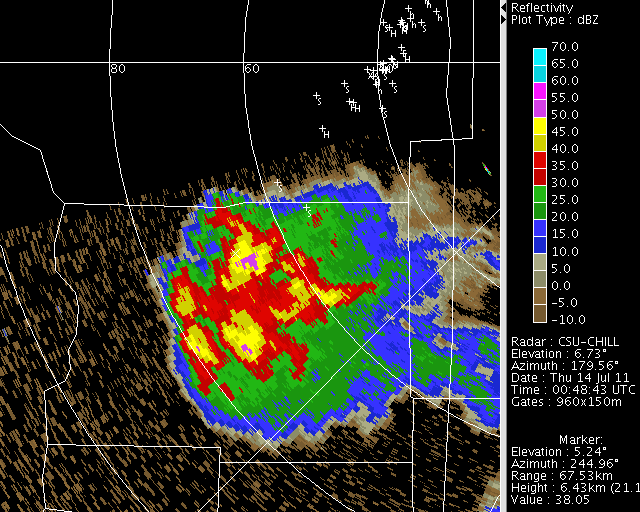
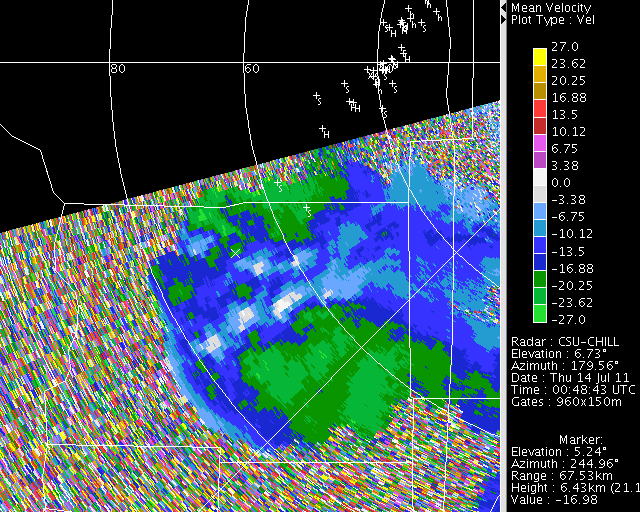
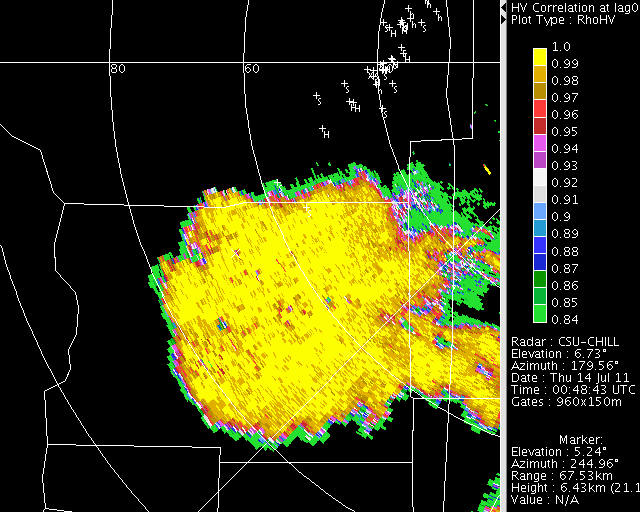
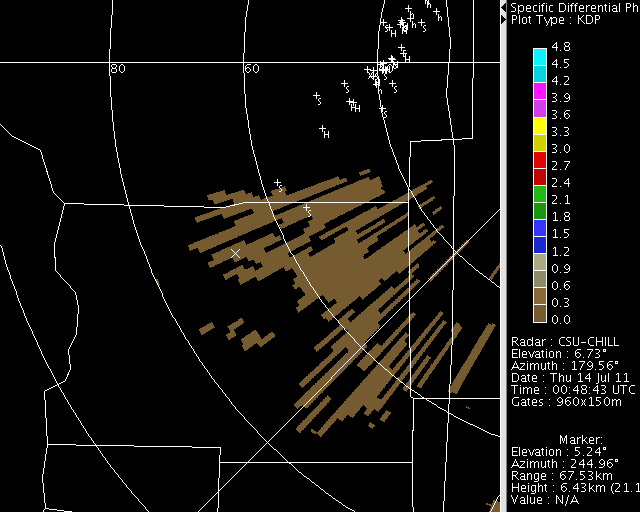
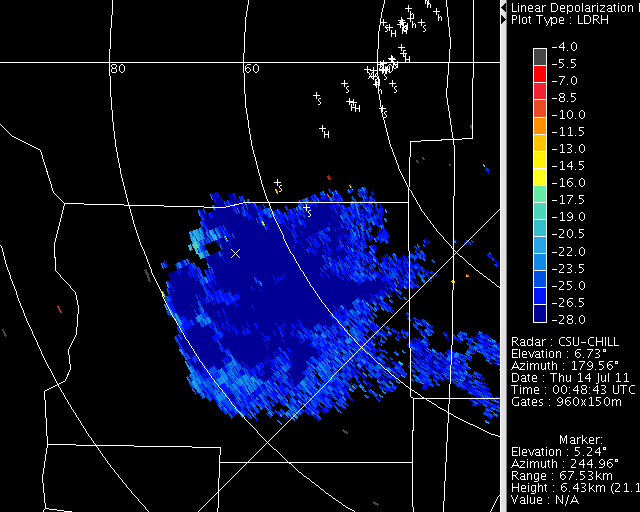
Reflectivity loop near -20C sounding temp level.
|
Click play to begin animation |
|
|
|
|
|
Click play to begin animation |
|
|
|
|
|
Click play to begin animation |
|
|
|
|
|
Click play to begin animation |
|
|
|
|
|
Click play to begin animation |
|
|
|
|
|
Click play to begin animation |
|
|
|
|
|
Click play to begin animation |
|
|
|
|
|
Click play to begin animation |
|
|
|
|
|
Click play to begin animation |
|
|
|
|
|
Click play to begin animation |
|
|
|
|
|
Click play to begin animation |
|
|
|
|
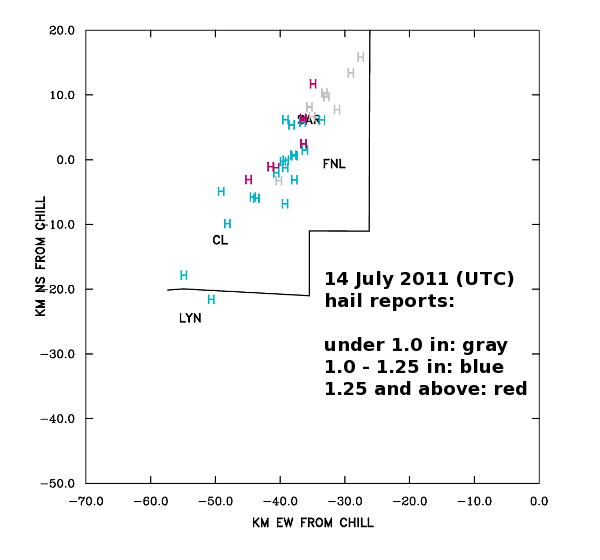
Spotter observations and NLDN data
Spotter confirmation of severe hail production took place primarily after the storm crossed into Larimer County. The CG lightning polarity also became predominately positive during this portion of the storm's history:
|
Click play to begin animation |
|
|
|
|
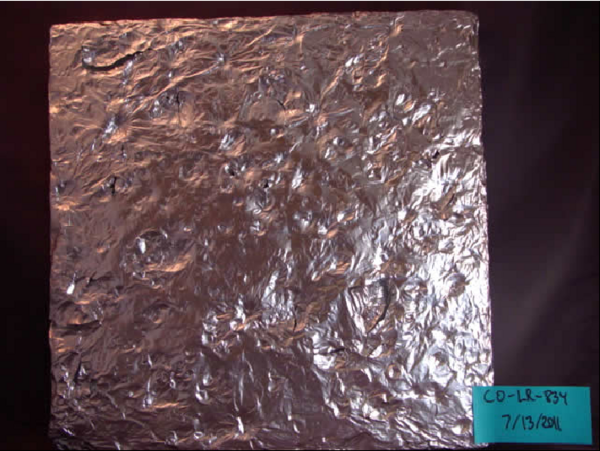
Surface verification of polarimetric signatures
(Low level polarimetric patterns are also emphasized in the NWS training materials).
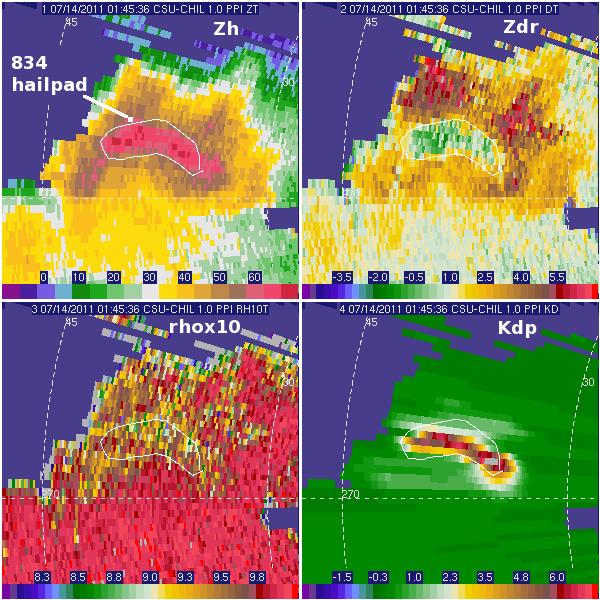
Hail impacts between 0140 and 0147 UTC; largest diameter=1.25 inches; leaves shredded.
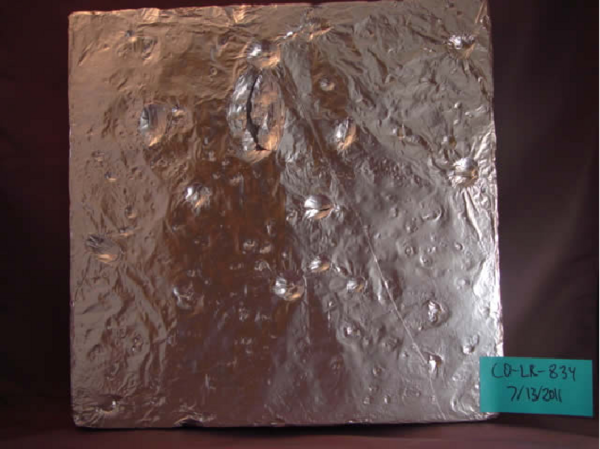
Hail impacts after pad change. Pad exposure time reported as 0147 - 0150 UTC. Impacts still sufficient to tear foil.
CAPPI plots: 7km MSL reflectivity
|

Click play to begin animation |
|
|
|
|
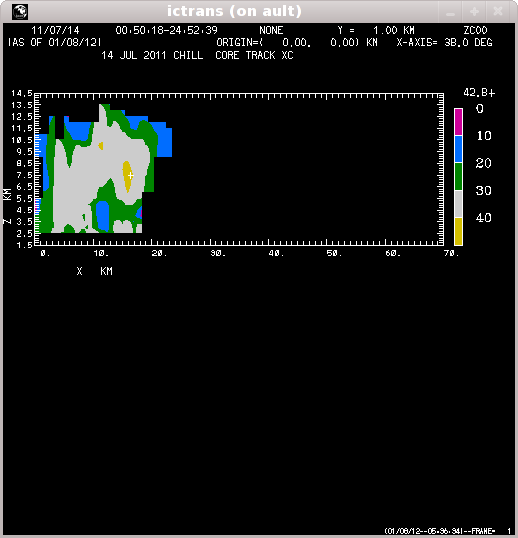
Rotated vertical XC plots: reflectivity
|
Click play to begin animation |
|
|
|
|
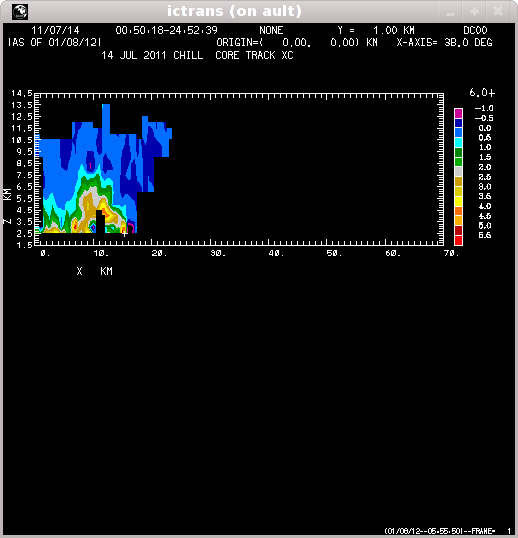
Rotated vertical XC plots: Zdr
|
Click play to begin animation |
|
|
|
|


