11jun2015 cell initiation: Difference between revisions
Pat kennedy (talk | contribs) No edit summary |
Pat kennedy (talk | contribs) No edit summary |
||
| Line 1: | Line 1: | ||
==Overview== | |||
During the afternoon hours of 11 June 2015 several clusters of thunderstorms to develop in the CSU-CHILL radar coverage area. One such cluster developed in the immediate vicinity of Loveland Colorado and produced locally flooding rainfall. The CSU-CHILL radar recorded this development via continuous 1.5 deg elevation angle 360 surveillance scans with an update cycle of ~1.6 minutes. This rapid update rate allowed the evolution of the Loveland area thunderstorm complex to be monitored in detail. As depicted in the following image, the low level convergence associated with a westward moving fine line was a significant factor in the initiation and intensification of the thunderstorm cells. | |||
[[Image:11jun2015 1936 fine line anot.png|center]] | [[Image:11jun2015 1936 fine line anot.png|center]] | ||
The three cells of particular interest developed in a sequential east to west manner as the fine line propagated through the Loveland area. These cells are identified in the next plot. | |||
| Line 6: | Line 11: | ||
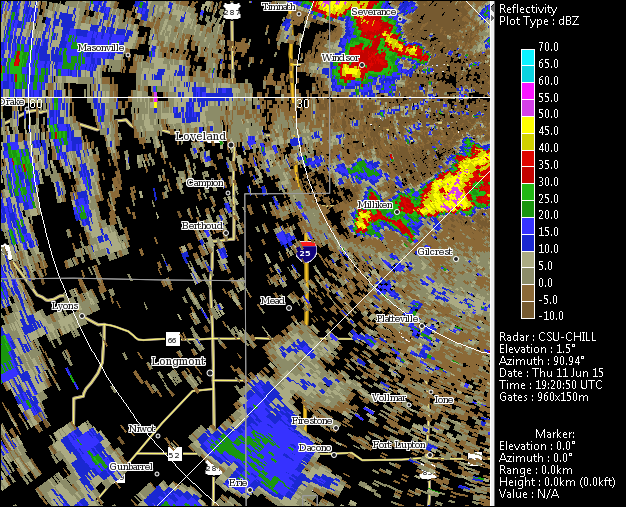
==Reflectivity Loop== | ==Reflectivity Loop== | ||
The evolution of the Loveland area thunderstorms is shown in the following image loop. The central cell (#2) intensifies at a rate of ~10 dB per scan between 1939 and 1946 UTC (loop frame numbers 13 and 18). | |||
<center> | <center> | ||
<imgloop delay=300 imgprefix="http://www.chill.colostate.edu/anim/11jun2015_LVE_cell_init/" width=640 height=512> | <imgloop delay=300 imgprefix="http://www.chill.colostate.edu/anim/11jun2015_LVE_cell_init/" width=640 height=512> | ||
| Line 47: | Line 54: | ||
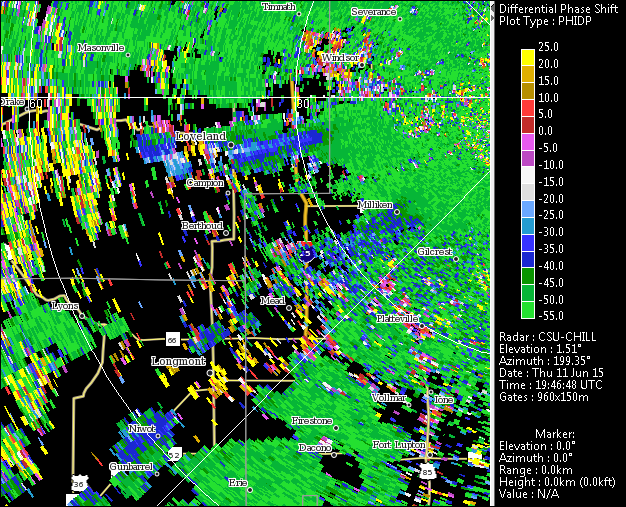
==Differential propagation phase loop== | ==Differential propagation phase loop== | ||
The next loop covers the later stages of the previously-shown reflectivity sequence when the three individual thunderstorm cells merged into a single east-west oriented echo system. This merged echo complex was aligned in a radial direction with respect to the CSU-CHILL radar. This orientation maximized the differential propagation phase shift between the H and V polarized waves as they propagated through an ~15 km long path through heavy rain. (i.e., propagation through the high concentration of oblate rain drops retarded the received phase of the H polarized return signal relative to the V returns.) | |||
<center> | <center> | ||
<imgloop delay=300 imgprefix="http://www.chill.colostate.edu/anim/11jun2015_LVE_cell_init/" width=640 height=512> | <imgloop delay=300 imgprefix="http://www.chill.colostate.edu/anim/11jun2015_LVE_cell_init/" width=640 height=512> | ||
| Line 67: | Line 76: | ||
</center> | </center> | ||
==Specific propagation differential phase at 2007 UTC== | |||
The final plot shows the one-way Kdp values in the radially-aligned echo complex at 2007 UTC. Kdp is the range derivative of the phidp profile along the radar beams. The peak Kdp values of ~3 deg / km imply that instantanenous rainfall rates of ~100 mm / hr were occurring. The NWS Boulder office issued a flash flood warning for this echo system. Co | |||
[[Image:11jun2015 2006 Z Kdp anot.png|center]] | [[Image:11jun2015 2006 Z Kdp anot.png|center]] | ||
Revision as of 04:16, 30 June 2015
Overview
During the afternoon hours of 11 June 2015 several clusters of thunderstorms to develop in the CSU-CHILL radar coverage area. One such cluster developed in the immediate vicinity of Loveland Colorado and produced locally flooding rainfall. The CSU-CHILL radar recorded this development via continuous 1.5 deg elevation angle 360 surveillance scans with an update cycle of ~1.6 minutes. This rapid update rate allowed the evolution of the Loveland area thunderstorm complex to be monitored in detail. As depicted in the following image, the low level convergence associated with a westward moving fine line was a significant factor in the initiation and intensification of the thunderstorm cells.

The three cells of particular interest developed in a sequential east to west manner as the fine line propagated through the Loveland area. These cells are identified in the next plot.

Reflectivity Loop
The evolution of the Loveland area thunderstorms is shown in the following image loop. The central cell (#2) intensifies at a rate of ~10 dB per scan between 1939 and 1946 UTC (loop frame numbers 13 and 18).
|
|
||
|
Differential propagation phase loop
The next loop covers the later stages of the previously-shown reflectivity sequence when the three individual thunderstorm cells merged into a single east-west oriented echo system. This merged echo complex was aligned in a radial direction with respect to the CSU-CHILL radar. This orientation maximized the differential propagation phase shift between the H and V polarized waves as they propagated through an ~15 km long path through heavy rain. (i.e., propagation through the high concentration of oblate rain drops retarded the received phase of the H polarized return signal relative to the V returns.)
|
|
||
|
Specific propagation differential phase at 2007 UTC
The final plot shows the one-way Kdp values in the radially-aligned echo complex at 2007 UTC. Kdp is the range derivative of the phidp profile along the radar beams. The peak Kdp values of ~3 deg / km imply that instantanenous rainfall rates of ~100 mm / hr were occurring. The NWS Boulder office issued a flash flood warning for this echo system. Co
