Selected dual polarization observations in a supercell thunderstorm: 8 June 2012
Author: P. C. Kennedy
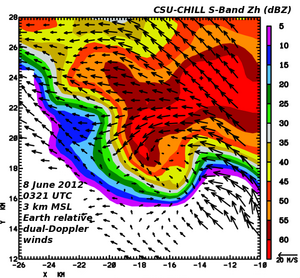
Horizontal wind field synthesized from coordinated CSU-CHILL and Pawnee radar volume scans done during the NSF-sponsored DC3 project. Plots of the dual-polarization data collected ~5 minutes later in an RHI scan through the low level inflow and hail core areas have been assembled.
Introduction
During operations for the DC3 field project on 7 June, 2012 (local date), a supercell thunderstorm developed in the western dual Doppler lobe formed by the CSU-CHILL and Pawnee radars. In synchronization with the Pawnee radar, CSU-CHILL began a volume scan at 0324 UTC on the 8th. This volume was interrupted after 4 sweeps to execute a series of RHI scans through the approaching storm. The following plot shows the dual Doppler-derived horizontal wind field at 2.75 km MSL based on the 0324 UTC volume data. (The NCAR SPRINT program was used to interpolate the data from the individual radars to a common Cartesian grid; the synthesis of the horizontal wind field components was done using CEDRIC.) Much of the reflectivity core was located within the radar baseline area, small radar beam intersection angles stopped the wind synthesis in this region. Since the CHILL did not execute a full volume scan, the color-filled reflectivity field was generated from the Pawnee radar data. The low level inflow maximized in the vicinity of the reflectivity "notch" adjacent to a dissipating mesocyclone circulation.
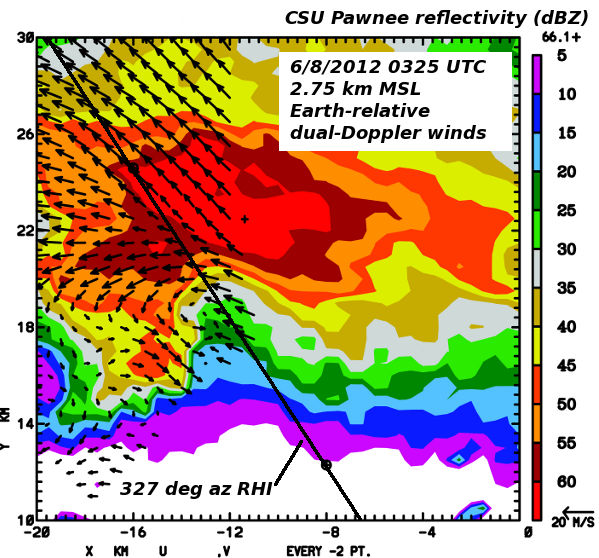
327 degree azimuth RHI data
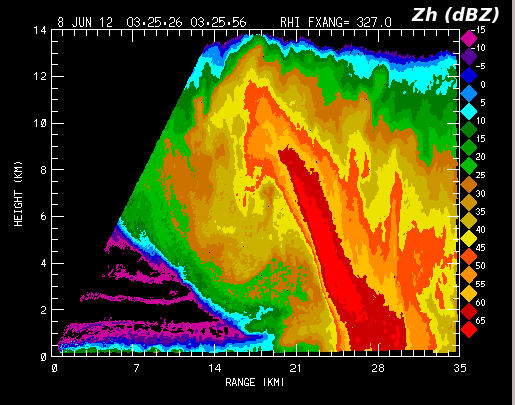
At 0325:26 CSU-CHILL performed an RHI scan through the inflow notch and the down-range high reflectivity core. The following series of plots present selected aspects of the data collected in this RHI sweep.
At ranges less than 21 km, the reflectivity pattern included the forward overhanging configuration associated with strong updrafts.
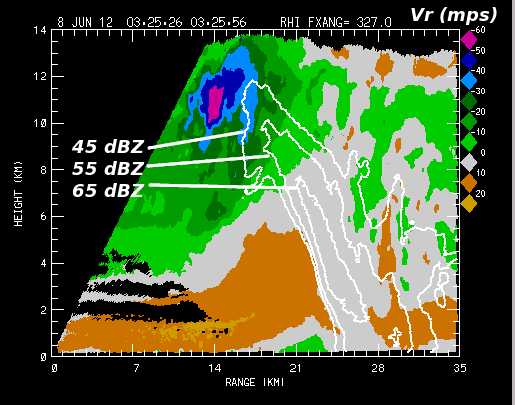
The radial velocity data showed a well-organized storm inflow pattern near the surface. Velocities maximized in the forward anvil where the combination of the environmental ambient winds and diverging outflow from the summit of the updraft combined to generate radial velocities in excess of 50 mps towards the radar (by convention, negative in sign).
The updraft was probably strong enough to cause drop size sorting in the inflow area around 21 km range. Since only relatively large, oblate drops would have a high enough terminal velocity to descend into this area, differential reflectivity (Zdr) values were quite positive at low altitudes in the inflow area. (The ingestion of insects flying in the boundary layer was probably also contributing to the positive Zdr regime.) Within the leading edge of the strong precipitation shaft, Zdr's quickly decreased as the radar pulse volume sampled an increasing fraction of quasi-spherical hailstones vs. the oblate raindrops in the inflow. The slightly negative Zdr values near the 24 km range suggest that some of the hail / graupel particles may have had their major axes oriented vertically. The slightly negative Zdr "shadow" located down-range of the reflectivity core suggests that differential attenuation was preferentially attenuating the horizontally-polarized signal relative to the vertically-polarized signal, especially in the vicinity of the melting level. (The environmental 0C level was at 3.3 km AGL in the 00 UTC Denver / DNR sounding data. Hydrometeor evaporation and melting lowered the 0C height within the precipitation core.)
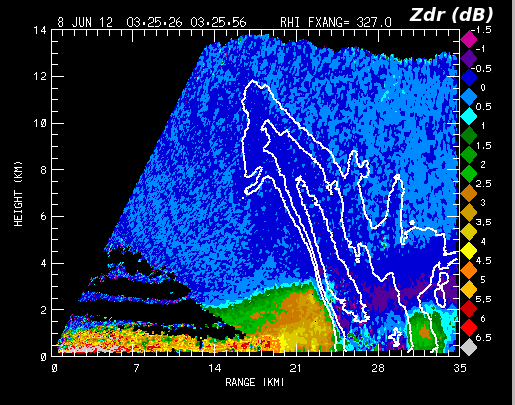
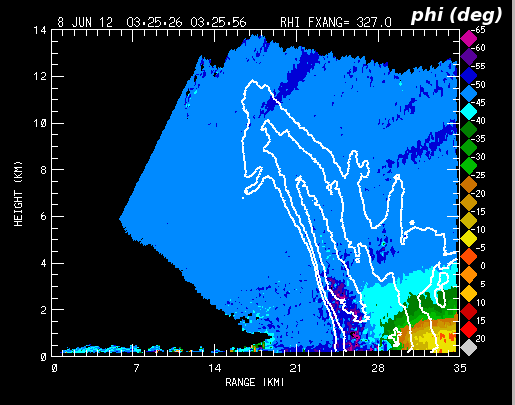
The differential propagation phase initially shifted in an upward direction along the color scale (i.e., towards dark blue and purple in the precipitation shaft near 24 km range. This reversed color progression is consistent with the vertical ice particle orientations that were implied by the negative Zdr's in this same region. Additional areas of up-scale color progression were apparent in the anvil region where electric field intensities strong enough to rotate the ice crystals towards a vertical orientation likely existed. At low levels beyond ~27 km range, the differential propagation phase values move appreciably down the color scale as forward scattering effects due to the large concentration of oblate raindrops increasingly lag the phase of the horizontally-polarized radar waves relative to the vertically-polarized waves.
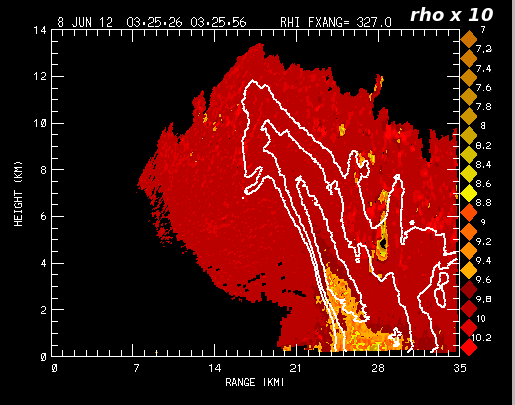
The correlation between the co-polar horizontally and vertically-polarized returns (rhoHV) was minimized in areas where diverse mixtures of hydrometeor sizes, orientations, and types / shapes existed due to the co-existence of frozen and liquid particles. (The rhoHV values have been multiplied by 10 in the following plot. No explanation is offered for the isolated rhoHV minimum located at range=28 km, height= 5 km AGL.)
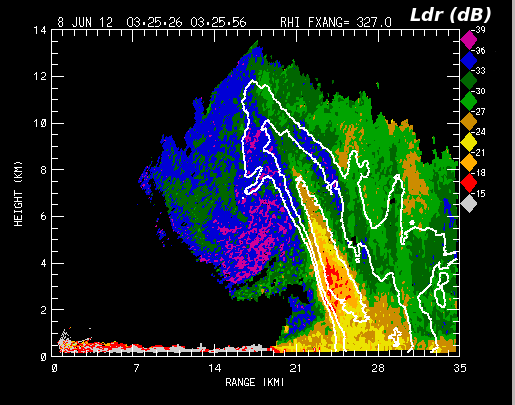
Linear Depolarization Ratio (Ldr) is also enhanced by the existence of high density, non-spherical ice particles whose major axes are orientated off the polarization plane of the incident radar pulses. (This enhancement is further magnified when the ice particles are wet.) The largest Ldr levels (cross-polar signal level ~18 dB below the co-polar signal level) occurred both above and below the melting level in the high reflectivity core. It is likely that a variable combination of drop freezing, ice particles undergoing "wet growth", and the melting of ice hydrometeors locally enhanced Ldr in this area.
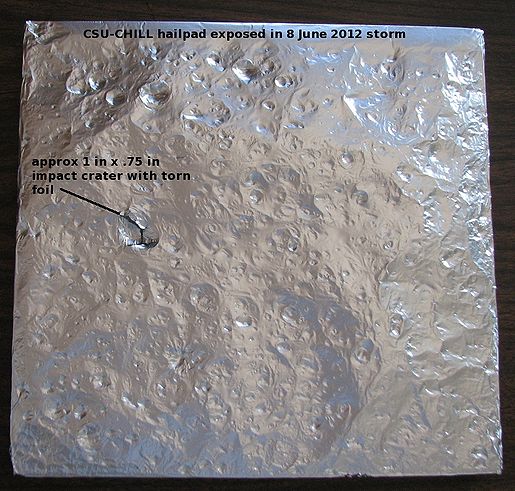
The remnants of the storm reached the CSU-CHILL radar site near 0440 UTC. A fresh Community Collaborative Rain, Hail, and Snow Network (CoCoRaHS) hail pad was exposed shortly before precipitation began. The larger, sharp-edged dents seen in the following hailpad picture were due to hailstones of up to ~0.75 inches in diameter. (The smaller depressions are generated by raindrops).
Summary
The severe thunderstorm activity observed by the CSU radars on 7 - 8 June 2012 will provide a useful data set for the DC3 project. (Although not presented here, the Northern Colorado Lightning Mapping Array (LMA) was also three dimensionally locating lightning discharges during this event.)