Rain to snow transition
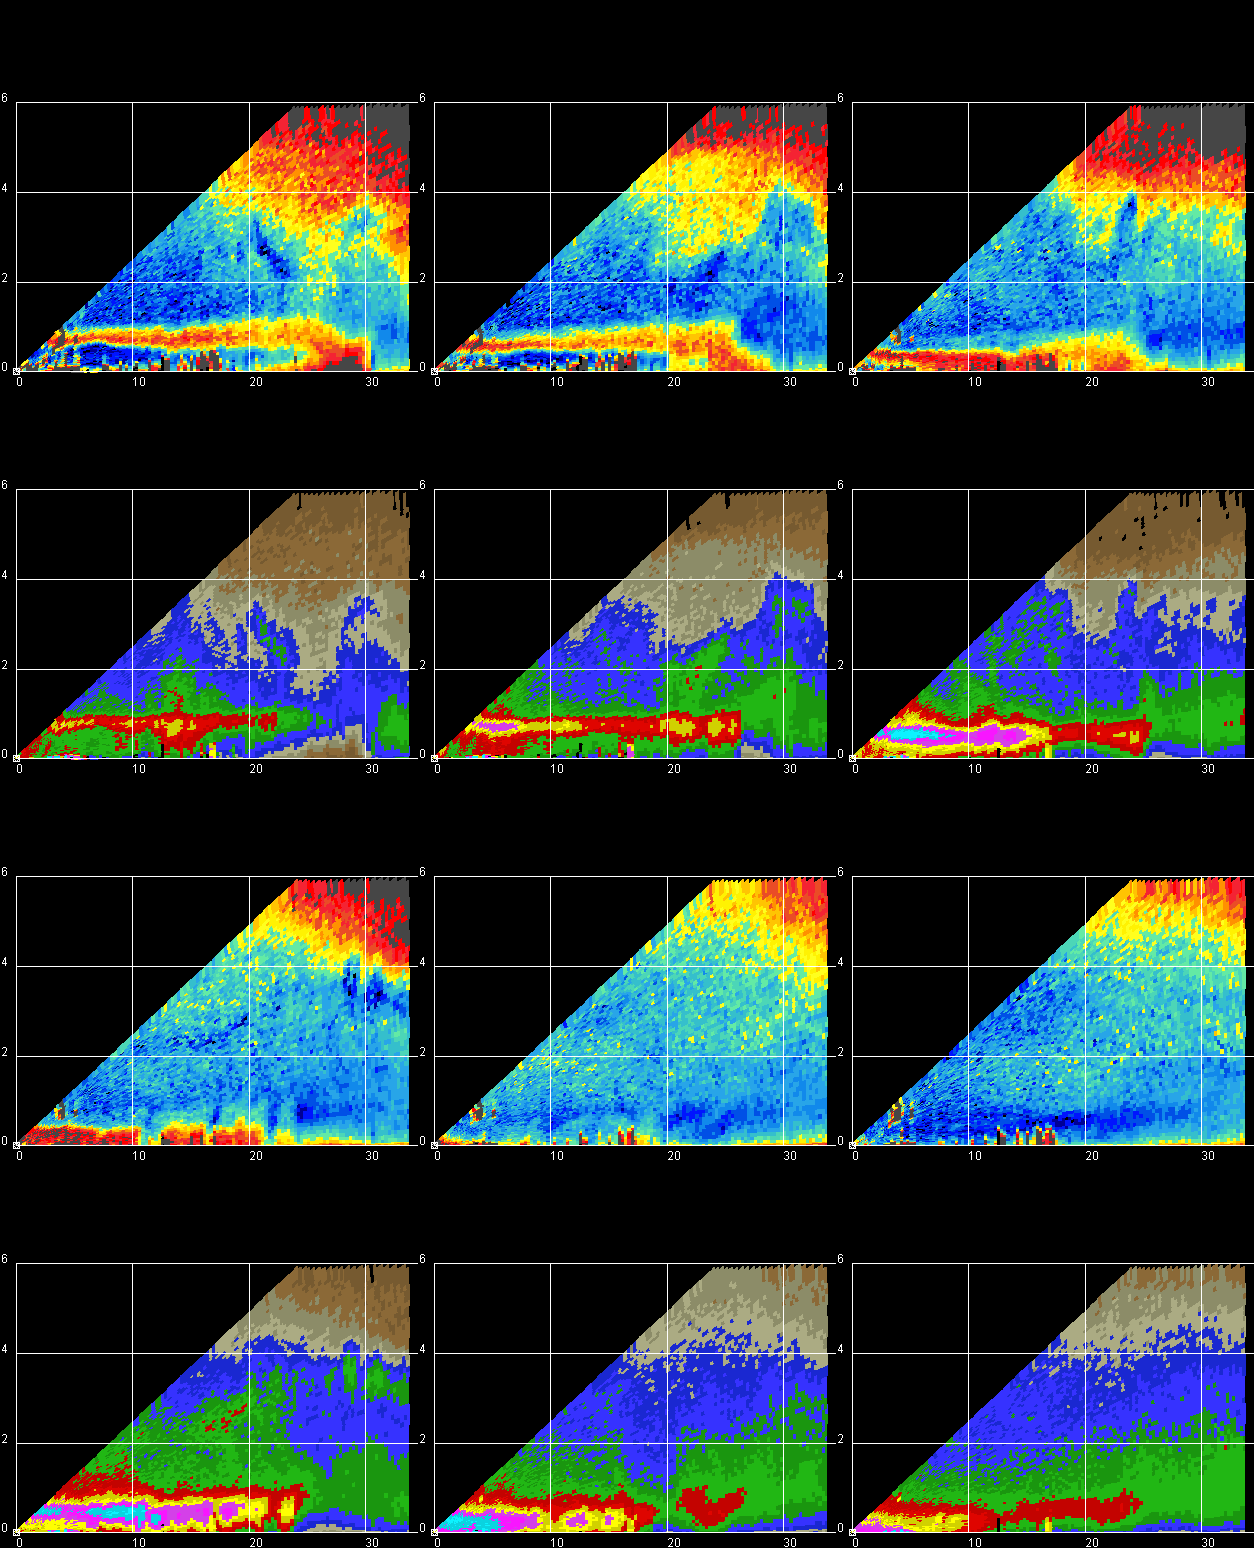


Conceptual Summary
Frozen hydrometeors begin to melt as they fall through the 0C temperature level. During the initial melting stage, the outer surface of the ice particles starts to become wet causing a corresponding increase in the refractive index value. The refractive index enhancement results in an increase in radar reflectivity.
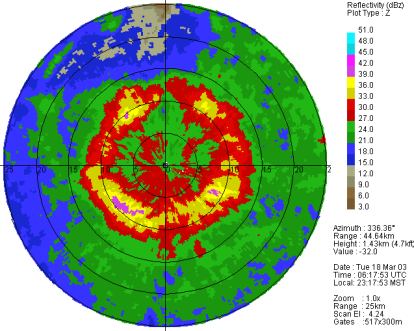
When melting is complete, the snow particles collapse into smaller diameter drops (i.e., smaller than their original frozen forms). The aerodynamic drag coefficient of the liquid drops is also less than that of the parent frozen particles, so the particle concentration decreases as the melted drops accelerate downward away from the melting zone. Under stratiform precipitation conditions, the combination of these effects leads to a layer of enhanced radar reflectivity (the bright band). (It should also be noted that the hydrometeor size distribution, and thus reflectivity, in the bright band is also affected by the additional processes of particle aggregation, breakup, etc.)
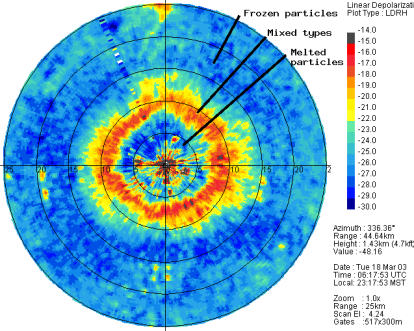
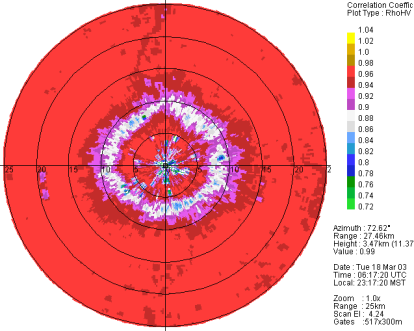
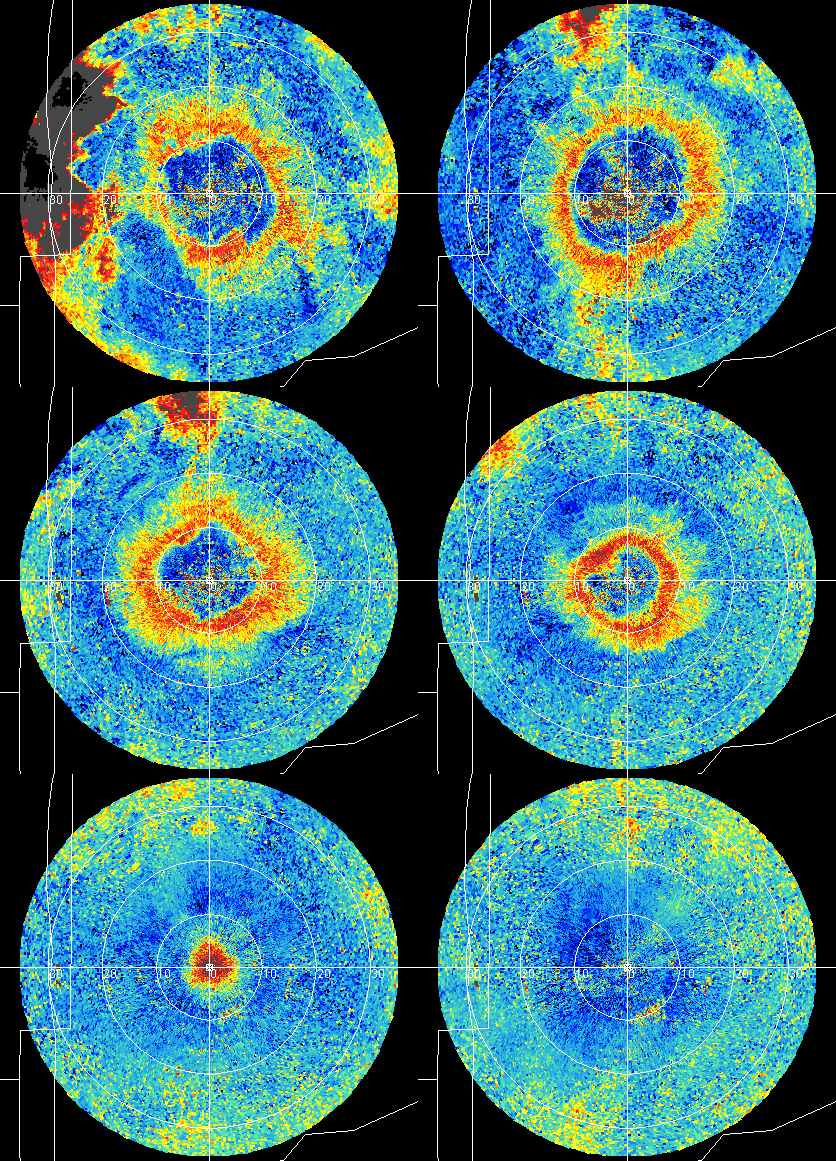
The most massive ice particles generally take the longest time to completely melt. Thus, the average diameter of the remaining frozen particles tends to increase for the first few hundred meters below the 0°C level. These large, wet, irregularly shaped melting hydrometeors cause an appreciable amount of depolarization in the backscattered radar signal. The pattern of a reflectivity bright band slightly above a layer of maximum Linear Depolarization Ratio (LDR) is evident in the RHI image loop series shown above. The precipitation type observed at the CSU-CHILL radar changed from rain to snow as the bright band descended to the surface. In PPI scans, the melting layer generally appears as a ring-shaped feature if the 0°C height is uniform. A ring of enhanced LDR values can be seen in the example images at right. There is also a corresponding ring of reduced values in the field (correlation between the horizontally and vertically polarized signal returns). is reduced by the combined existence of the large, still-melting snow particles with the smaller, completely melted drops.

VCHILL
Main article: VCHILL
References
- Herzegh, P. H. and A. R. Jameson. 1992: Observing Precipitation through Dual-Polarization Radar. Bull. Amer. Meteor. Soc., 73, pp 1365-1374.
- Zrnic, D. S., N. Balakrishnan, C. L. Ziegler, V. N. Bringi, K. Aydin, and T. Matejka. 1993: Polarimetric Signatures in the Stratiform Region of a Mesoscale Convective System. J. Appl. Meteor., 32, pp 678-693.
