DPWX/Varying thunderstorm Zdr patterns: 13 June 2016
Authors: Patrick C. Kennedy and Francesc Junyent

CSU-CHILL S-band data interpolated to the 4.5 km MSL constant height surface. While the reflectivity levels in the two thunderstorms are generally similar, only the northern storm has an area of positive Zdr values at this height. Other plots showing additional contrasting characteristics of these two storms have been prepared.
Overview
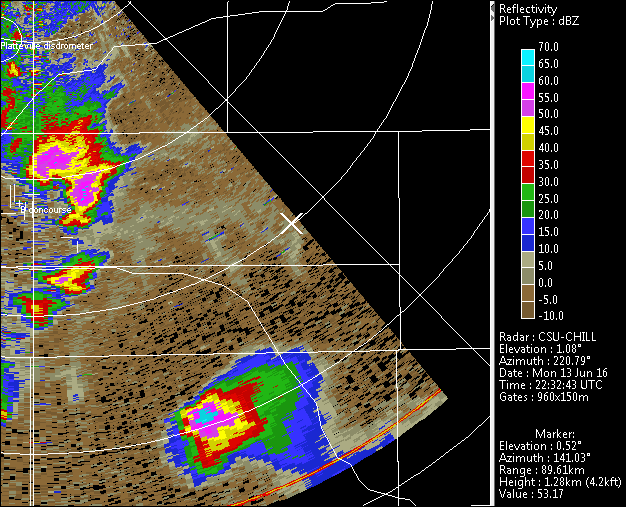
Multiple thunderstorms, some severe, occurred in the coverage area of the CSU-CHILL radar during the afternoon of 13 June 2016. Data was collected primarily using PPI sector scans along with occasional two-sweep RHI volumes. One RHI sweep done at ~2305 UTC intercepted two separate thunderstorms with contrasting Zdr characteristics at near surface heights. The following PPI plot at 2307 UTC shows the general echo configuration. The two storms of interest, one at a range of 60 km, and the second at 90 km range along the 141 degree azimuth, are indicated. An outflow boundary was also present near the 60 km range storm.

S-band PPI image loops
The next image loops show the history of the two storms of interest during the 2233 - 2307 UTC period as depicted by the 0.5 deg elevation reflectivity data. Both storms contained core reflectivities of ~60 dBZ. According to SPC storm reports, the southern storm produced 2.75 inch diameter hail 7 miles north of the town of Deer Trail at 2256 UTC. The northern (60 km range) storm was generally propagating along the outflow boundary.
|
|
||
|
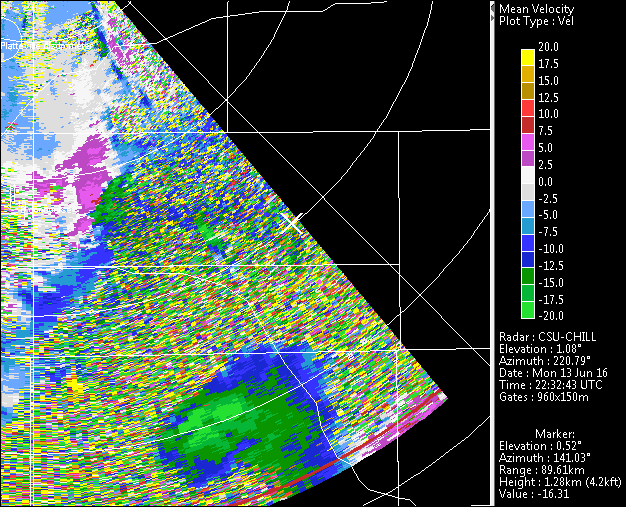
The corresponding radial velocity loop shows the outflow boundary-related convergence along the southern edge of the nearer (60 km range) storm.
|
|
||
|
S-band RHI data at 2305 UTC
Selected plots from the 141 degree azimuth RHI sweep that intercepted both storms at 2305 UTC are shown below. The reflectivity core in the 90 km range storm extended down to the lowest observed heights, while the 60 km range storm featured an elevated reflectivity core. (For reference, the 58 dBZ contour line is shown in blue in the succeeding RHI plots):

Both storms showed indications of updraft-related divergence at echo top level. Low-level convergence was found near the southern edge of the 60 km range storm:

As marked in the following plot, the Zdr regimes at low levels in the two storms were quite different. The 90 km range storm contained an area of near 0 dB Zdr that reached down to the surface. This low Zdr / high reflectivity combination is typical of hail areas where quasi-spherical, tumbling hailstones tend to equalize the horizontally and vertically-polarized received signals. In the 60 km range storm, low level Zdr in the precipitation shaft was distinctly positive (+4 to +5 dB). These positive values indicate the presence of oblate hydrometeors, producing an H signal level that was appreciably stronger than the V received signal level. This upward extension of positive Zdr values into the sub-freezing levels of thunderstorm updrafts is in good agreement with the "positive Zdr column" echo feature (Kumjian et al., JAMC 2014 1820 - 1843). In addition to the updraft-induced raindrop lofting and size sorting effects, any melting small ice particles falling from the suspended reflectivity core probably had a melt water torus about their "equator", giving them a flattened shape that would promote positive Zdr values in the near-surface echo core region of the 60 km range storm.

X-band rhoHV characteristics in the 60 km range storm
The next plot series includes the HV correlation coefficient (rhoHV) data collected by the X-band channel of the CSU-CHILL radar. The 90 km range storm was mostly beyond the X-band system's processing limit, so only the 60 km range storm is considered. To emphasize the locations of significantly reduced rhoHV, the solid blue contour overlay shows the 0.85 and 0.70 X-band rhoHV values. (To eliminate noise contributions, an SNR threshold of 15 dB was applied to the X-band rhoHV data). With respect to the S-band reflectivity field, the low rhoHV region occurred in the forward portion of the suspended echo core:

The X-band rhoHV minimum spanned the upper portion of the positive Zdr column:

The final plot in this series shows the close relationship between low X-band rhoHV and an area of enhanced S-band Linear Depolarization ratio (LDR). This LDR enhancement was probably due to increased concentrations of non-spherical, wobbling, high water content ice particles such as wet graupel and freezing raindrops (Herzegh and Jameson, BAMS 1992 p. 1365-1374). If these ice particles occur in diameters of ~1 cm, Mie resonance effects can contribute significantly to the reduction of X-band rhoHV. (It is noteworthy that the S-band rhoHV did not fall below ~0.94, suggesting that the particle diameters remained in the Rayleigh scattering regime with respect to the 11 cm wavelength of the S-band channel).

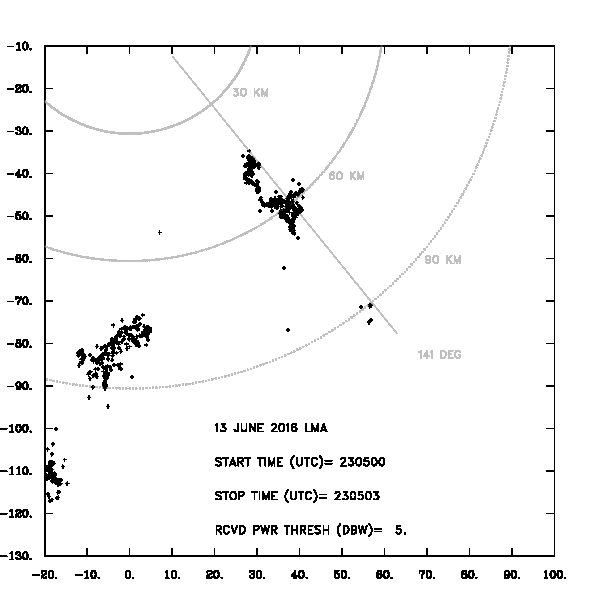
LMA data in 3 second time intervals for the minutes of 2305 and 2306 UTC on 13 June 2016.
An additional area of contrast between the 60 and 90 km range storms is provided by lightning activity as detected by the Northern Colorado Lightning mapping Array (LMA). The final loop shows the locations of lightning discharges detected by this LMA network during a two minute period (2305 and 2306 UTC) that contained the RHI volume that was shown above. Each loop frame shows all discharge locations (without regard to altitude) during successive 3 second time blocks. While lightning activity, including some ~20 km long flashes, was present in both storms, the 60 km range storm was generally more electrically active than the 90 km range storm. This is consistent with the radar indications of a vigorous updraft in this storm (surface convergence coupled with storm-top divergence, positive Zdr column, etc.)
|
|
||
|