DPWX/Selected dual wavelength observations of hail: 12 June 2017
Authors: Patrick Kennedy and Francesc Junyent

CSU-CHILL S-band reflectivity data in a 2.4 degree elevation angle PPI scan at 2055 UTC on 17 June 2017. Inset picture is a photograph taken by a CoCoRaHS observer of an ~1 inch diameter, irregularly-shaped hailstone at ~2058 UTC. Plots of selected S and X-band CSU-CHILL data fields from the hail observation period have been prepared.
Overview
Several severe thunderstorms affected the northwestern half of the CSU-CHILL coverage area on 12 June 2017. Initially, the primary severe weather aspect of these storms was large (> 1 inch diameter) hail. Later, as the activity crossed over the Wyoming state line, several tornadoes were reported. A number of the hail reports were made by volunteer observers in the Community Collaborative Rain, Hail, and Snow (CoCoRaHS) network. One such observer noted an episode of irregularly-shaped hailstones (including both "lumpy" and "flying saucer" shapes) at a location ~30 km northwest of the CSU-CHILL radar just before 2100 UTC. CSU-CHILL scans in both PPI and RHI mode were made through the storm that passed over the CoCoRaHS observer's location. Selected radar data plots associated with the cooperative observer's hail report are shown below.
PPI scan and photographic data: 2057 - 2103 UTC
The low-level echo situation is shown in the following constant height (2.8 km MSL / 1.4 km AGL) plot. At the analysis time (2057 UTC), reflectivity levels of ~55 dBZ were present at the observer's location in the southwestern portion of the echo core. The horizontal wind vectors were synthesized from the radial velocities observed by CHILL and NWS Cheyenne (KCYS) radars. Strong (~ 20 mps) inflow was occurring on the southeastern side of the echo system.

A photograph of the clouds and precipitation occurring to the northwest of the CHILL site at approximately this same time (2103 UTC) is shown next. The lowered, visually rain-free cloud base is consistent with a strong updraft associated with the well organized inflow seen in the dual Doppler wind field.

The final 2.8 km MSL CAPPI plot shows contours of the Hail Differential Reflectivity (HDR) parameter calculated from the gridded CSU-CHILL radar data. HDR identifies areas where the presence of hailstones lowers differential reflectivity (Zdr) relative to the Zdr level that would be expected if the precipitation was composed only of raindrops (Aydin et. al, JAMC, 1987). Positive HDR values are associated with an increasing hail probability. Positive HDR values were present at the CoCoRaHS observer's location at this time.

The CoCoRaHS observer provided a photograph of one of the irregular hailstones that was collected at ~2058 UTC. Rounded lobes characterize much of the main stone's outer surface. The irregularity of this particular stone is further enhanced by a prominent lump visible in the lower left corner. It appears that this lump may be a smaller ice particle that became fused with the larger hailstone. In any event, the overall shape is an appreciable departure from the spheroidal forms that are often assumed for hailstones.

S-band RHI scan data at 2055 UTC
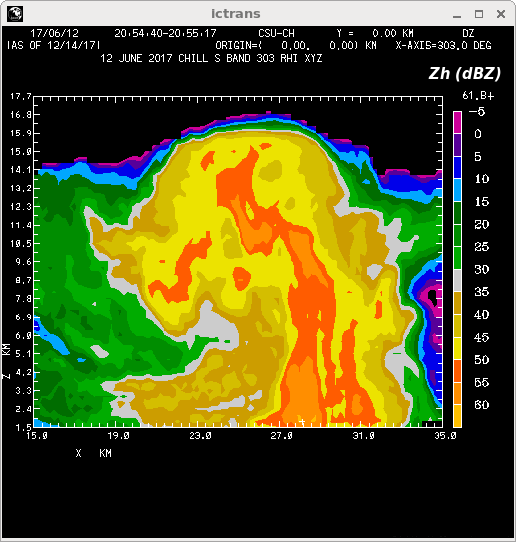
The following collection of plots selected S-band data fields from an RHI scan done on an azimuth of 303 degrees at 2054 UTC. (The location of this RHI plane is shown in the preceding HDR plot). These plots are best viewed by stepping ahead using the "Fwd" screen button. Some highlights of the various plots are:
- Frame 1 (reflectivity): An "overhang" of higher reflectivity values is present aloft in the ~23 - 27 km range interval. This structure implies an updraft speed that is strong enough to suspend / loft large diameter hydrometeors.
- Frame 2 (unfolded radial velocity): Low level inflow exceeds 20 mps on the near-range side of the main precipitation shaft. A well-defined divergence pattern exists at echo top, with inbound radial velocities exceeding - 50 mps.
- Frame 3 (differential reflectivity / Zdr): The positive Zdr values associated with the storm inflow are swept into a column that reaches ~6.5 km MSL. The slightly negative Zdr values above the top of the positive Zdr column may be an indication of conical graupel. Within the main precipitation shaft (~27 km range), suppressed Zdr values indicate that hailstones are likely to be present in the near-surface precipitation. (This is consistent with the positive HDR regime that was found in the earlier CAPPI plot.)
- Frame 4 (rhoHV x 10): Correlation coefficients are locally reduced below .90 in the area just above the top of the positive Zdr column (range ~27 km, height ~8.5 km MSL). This reduction is probably associated with the diverse population of particle shapes and thermodynamic phase states that exists as the strong updraft progresses into the subfreezing temperatures. Reduced rhoHV is also seen in the near-surface mixed hail - rain precipitation area.
- Frame 5 (Linear Depolarization Ratio (LDR)): LDR is enhanced where water-coated, non-spherical ice particles become canted to large angles with respect the horizontal polarization plane. This situation is likely to exist where the growing graupel and hailstones are exposed to the supercooled liquid water that the strong updraft generated near range=27 km, height=7.5 km MSL.
|
|
||
|
X-band Mie scattering indications
Mie scattering effects become more pronounced when hydrometeor diameter is an appreciable fraction of the radar wavelength. The diameter associated with the Rayleigh to Mie transition depends on the microwave refractive index of the particle. A major factor influencing refractive index is the hydrometeor's physical state (i.e, water vs. ice). For the 3 cm X-band wavelength, Mie effects become important for water drop diameters of ~6 mm and ice particle diameters of ~ 1 cm.
One manifestation of Mie scattering is the development of significant amounts of differential phase shift upon backscattering (delta). Through forward scattering effects, the difference between the horizontally and vertically polarized received signal phases changes in a monotonic manner with increasing range where the radar beam path contains sufficient concentrations of non-spherical, oriented hydrometeors. In the case of oblate rain drops, the propagation of dual polarization radar waves through a region of moderate to heavy rain will cause the phase of the H return to lag relative to the V wave return. In contrast, differential phase shift upon backscattering produces a local region of altered H vs. V received phase. This localized phase disruption does not significantly shift the down-range phase profile. As a result, Mie-induced delta effects appear as "bumps" on the overall differential propagation phase range profile.
The top panel of the following plot shows the range profile of differential propagation phase (phidp) for a ray of CSU-CHILL X-band data. The ray (elevation angle 11.72 degrees) was extracted from the same RHI sweep shown above. A Mie scattering-related delta bump is evident in the 27 - 30 km range interval. This ~15 deg phidp jump is similar to the fluctuation seen in calculations of X-band radar observations of ~ 25 mm (1 inch) diameter hail (Tromel et al, JAMC 2013, p2529-2548; Fig. 7). In the second panel, a distinct dip in the correlation values occurs in this same general range interval. This is consistent with previously reported correlation reductions associated with Mie scattering (Balakrishnan and Zrnic, JAS, 1990, p1525-1540.) For both of these data traces, the plotting color was changed to red in the Mie scattering region. The color change thresholds were arbitrarily defined as phidp > 106 degrees and rhoHV below 0.8. The third figure panel shows that the Mie scattering area in this ray was located at heights around 7 km MSL.

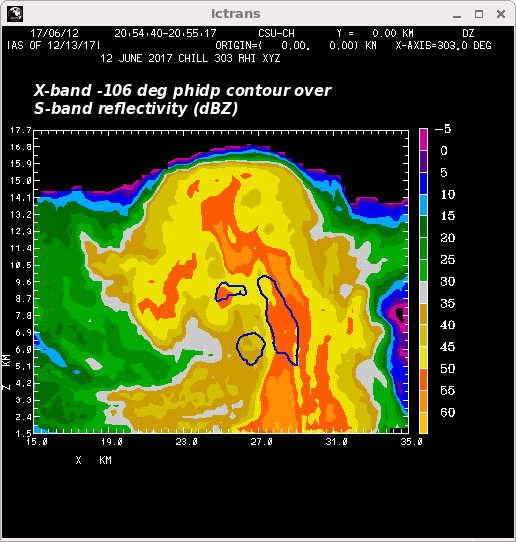
To provide a reference, the final collection of RHI plots repeats some of the previously shown S-band fields. Single, solid contour overlays have been added to identify the regions where X-band phidp was locally "bumped" above -106 deg and rhoHV was reduced below 0.8 (i.e., the regions of interest identified in the ray plot). To focus on the identification of hail growth areas, the X-band data at heights below 4.8 km MSL was excluded from these overlay plots. The Mie scattering indications in the X-band data are useful for confirming the presence of ~ 1 cm and larger diameter hailstones in mid-tropospheric levels of the updraft. These X-band Mie scattering indications are consistent with the physical hail characteristics documented in the CoCoRaHS observer's photograph. (Clearly, using a single hailstone to represent storm-scale radar signatures is an overly simplified view point).
|
|
||
|