DPWX/Microburst evolution: 6 September 2018
Author: Patrick C. Kennedy

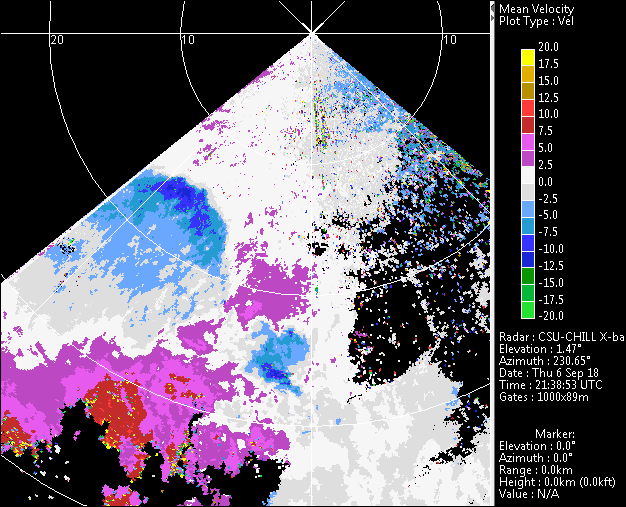
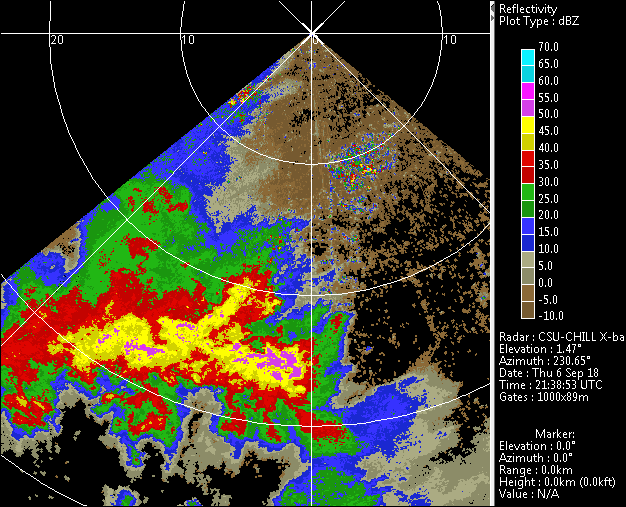
CSU-CHILL X-band reflectivity data in a 4.5 degree elevation PPI scan of afternoon thunderstorms on 6 September 2018. RHI scans at 3 minute time intervals documented the development of a microburst beneath the indicated storm.
Overview
An area of non-severe, rather ordinary, thunderstorms moved east from the foothills of the Rocky Mountains during the afternoon hours of 6 September 2018. In the first portion of the CSU-CHILL radar data collection period, a continuous series of 4 sweep RHI volumes were run. To maximize the length of time that the echoes remained in the RHI planes, the azimuth angles were selected so that they were generally along the echo motion direction as estimated from NWS KFTG radar image loops. Following this period of RHI scanning, a PPI sector scan composed of two low elevation angles and covering the southern azimuth sector was established. Both scan regimes captured the evolution of several aspects of the convection.
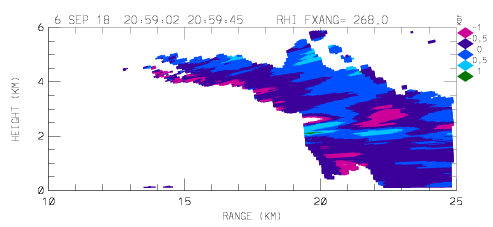
X-band RHI loops on the 268 degree azimuth
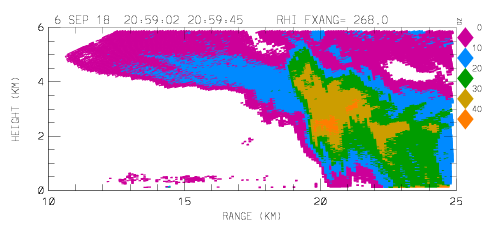
The sequence of echo patterns observed in the first RHI sweep (azimuth 268 degrees) showed an echo core whose centriod descended with time as it approached the radar. The time step between the images is ~3 minutes.
Reflectivity loop
|
|
||
|
Radial velocity loop
The final frame of the radial velocity loop shows the appearance of of divergence pattern centered near the 19.5 km range. At this time, the inbound (negative) and outbound (positive) radial velocity features are only separated in range by ~2 km. This meets the definition of a microburst (surface-based divergence pattern under 4 km horizontal scale).
|
|
||
|
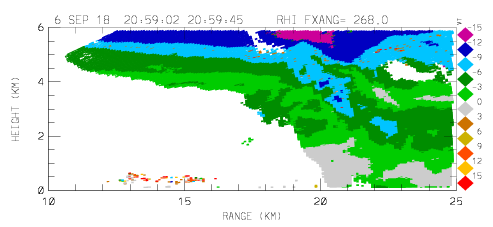
Differential reflectivity (Zdr) loop
The most positive Zdr values appear as the reflectivity core descends and vertically elongates below the melting level. (The melting level is visible as the thin, enhanced positive Zdr layer near 2.5 km AGL). This is likely due to development of oblate hydrometeors that are initially partially melted ice particles that transform into large raindrops as they descend into increasingly warm environmental temperatures. The combined high concentration, preferred oblate shape, and increasingly large refractive index values of the hydrometeors descending in the precipitation column cause differential attenuation to become significant towards the end of the loop. This is manifest as the negative Zdr "shadow" that appears down-range of the rain shaft.
|
|
||
|
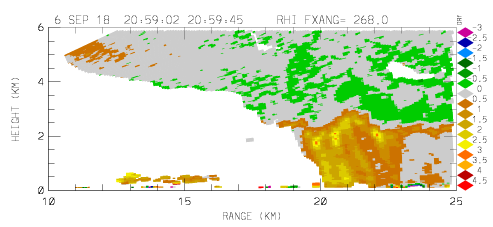
Specific differential propagation phase (Kdp) loop
Patterns of positive Kdp provide another indication of enhanced volumetric concentration of oblate hydrometeors. The highest one-way Kdp values appear ~1 km below the melting level in the fourth frame (2108 UTC). The reduction in Kdp below this maximum may be due to drop breakup from collisions, hydrodynamic instabilities inside the large drops, etc. that reduce the concentration of large, more oblate drops. It is also likely that the drop trajectories did not remain within the RHI scan plane.
|
|
||
|
The following photograph of the rain shafts to the southwest of the radar was taken from the CHILL site at 2113 UTC, near the end of the RHI image loop. The camera view does not contain the 268 degree RHI azimuth, but it provides an example of the appearance of the rain shafts at this time.

PPI reflectivity loop
As suggested by the rain shaft photograph, the thunderstorm area was centered in the southwest azimuth quadrant by ~2135 UTC. To monitor this area, a two sweep PPI (elevation angles 0.5 and 1.5 degrees) was established. This scan repeated at intervals of ~54 seconds. The following loop shows the sequence of 0.5 degree X-band reflectivity images from the thunderstorm area that was nearest to the radar in the southwest quadrant.
|
|
||
|
PPI radial velocity loop
The final loop shows the corresponding radial velocity data. Several thunderstorm outflow-related convergence patterns are evident. An initially isolated area of strong inbound radial velocities starts to appear ~25 km to the south-southwest of the radar at 2141:42 UTC (frame 4). This few km scale divergence maximum then expands and weakens with time. These rapidly changing, small scale wind field variations have significant impacts on take off and landing operations at airports, the advection air pollutants, etc.
|
|
||
|