DPWX/High time resolution PPI scans of thunderstorm precipitation: 30 July 2017
Author: Patrick C. Kennedy

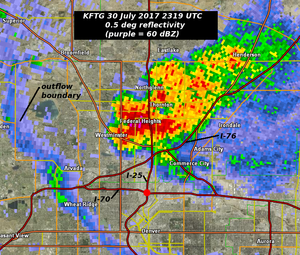
NWS Denver / Front Range (KFTG) radar reflectivity data collected while a thunderstorm complex was located just north of the city of Denver on 30 July 2017. The CSU-CHILL radar observed the near-surface evolution of this system through PPI sector scans that repeated at ~1 minute intervals. Time lapse loops of selected CSU-CHILL data fields have been prepared.
Overview
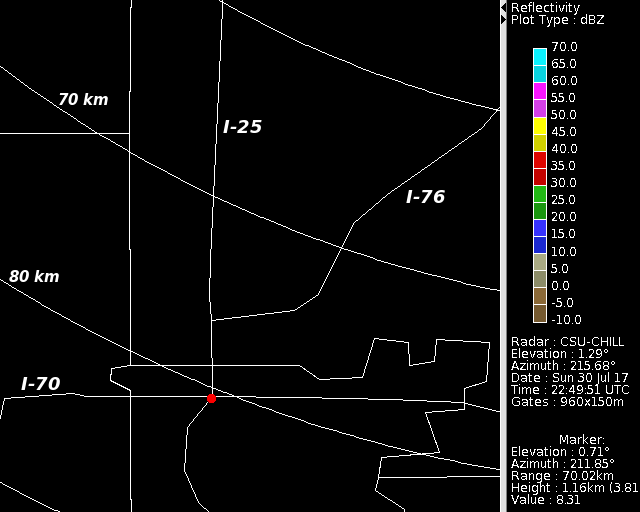
An isolated thunderstorm complex moved southward into the area located just north of the city of Denver during the late afternoon hours of 30 July 2017. CSU-CHILL radar observations of this storm were made using PPI sector scans composed of just two low elevation angles (0.7 and 1.4 deg). This restricted scan pattern allowed the sweeps to repeat at an ~1 minute time interval. The storm generally followed interstate highway I-25 as it approached Denver. For reference, I-25 as well as two other interstate highways are marked in the following base map. A red dot identifies the intersection of I-25 and I-70, this intersection is located within the northern portion of the city of Denver's irregular boundary.

Reflectivity loop
The following loop shows the reflectivity data in the 0.7 degree elevation angle PPI sweep. (At the time of the image capture, the elevation angle shown in the annotation block has moved towards the second sweep angle.) The loop covers a one hour and ten minute period (2250 - 0000 UTC). In the early frames of the loop, a westward-moving outflow boundary can be seen near the left edge of the images. A major aspect of the echo evolution is the sequential development of new reflectivity maxima in the immediate vicinity of I-25. Apparently following the outflow boundary motion, these high reflectivity regions appear at more westward locations with time. The peak intensities in these cores briefly reach levels of 55 - 60 dBZ.
|
|
||
|
Differential propagation phase loop
The next loop shows the corresponding differential propagation phase (phidp) data. As the concentration of oblate raindrops increases along the beam path traversed by the radar pulses, the propagation of the horizontally polarized waves becomes increasingly retarded with respect to the propagation of the vertically polarized waves. The colors in the individual loop frames indicate the difference in degrees between the phase angles of the received H and V waves. Increasing retardation of the H waves is indicated by an upward shift along the color bar with increasing range (i.e., going from blue through white towards pink and red with increasing range along a given radial.) Localized episodes of enhanced differential propagation phase shift can be seen to appear and fade in association with the reflectivity maxima that were seen in the previous loop.
|
|
||
|
Specific differential propagation phase loop
The final loop shows the one-way specific differential propagation phase (Kdp). This is the range derivative of phidp. Regions of significant positive Kdp (several degrees per km) are associated with high rain rates. Since Kdp is relatively unaffected by the presence of hailstones, the rain rate estimations based on Kdp are generally more accurate than those provided by reflectivity, especially in intense thunderstorm precipitation. The loop shows evolution of several enhanced Kdp episodes within the overall thunderstorm complex. The rain rates within these Kdp maxima exceed 100 mm / hr (~ 4 inches / hr). These intense rain rates significantly affect highway travel in terms of restricting driver visibility and increasing the probability of tire hydroplaning.
|
|
||
|
CoCoRaHS rainfall map
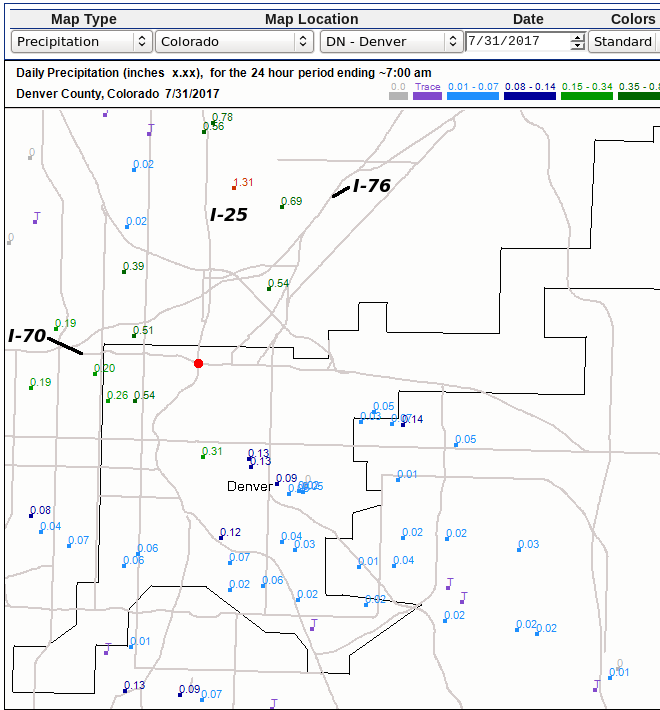
The final plot shows the 24 hour precipitation accumulations reported by observers in the Community Collaborative Rain, Hail, and Snow network (CoCoRaHS) on the morning of 31 July 2017. To aid the correlation with the preceding radar plots, selected Interstate highways have been marked and a red dot has been placed at the intersection of I-70 and I-25. As might be expected from the rapidly evolving reflectivity and differential propagation phase patterns, the rainfall totals are quite variable, with only one report exceeding one inch (1.31 inches from the vicinity of Thornton, Colorado). In agreement with the patterns in the radar data loops, the higher precipitation totals shift to the west side of I-25 in areas closer to the Denver city limits.


