DPWX/Descending melting level: 18 May 2017
Author: Patrick C. Kennedy

CSU-CHILL S-band 273 deg azimuth RHI scan through a melting layer at 17 UTC on 18 May 2017. Reflectivity (upper panel) shows the "bright band" signature. RhoHV x 10 (lower panel) contains reduced correlations in the melting zone. At the time of this scan, METAR observations reported snow at Ft. Collins - Loveland Airport and rain at Greeley. PPI scan time lapse loops covering the rain to snow transition at Greeley have been prepared.
Overview
A significant late spring storm started affecting much of the CSU-CHILL radar coverage area during the morning hours 18 May 2017. Wet snow accumulated at the higher terrain elevations around Fort Collins (~1530 m MSL). At the slightly lower (1432 m MSL) CHILL radar site, the precipitation was mostly rain until the mid to late afternoon hours (all of the above-mentioned times are local). The CSU-CHILL conducted 360 PPI scans during much of this event. The descent of the melting level towards the surface in the CHILL / Greeley area was observed in the co-polar correlation coefficient (RhoHV) dual polarization data field.
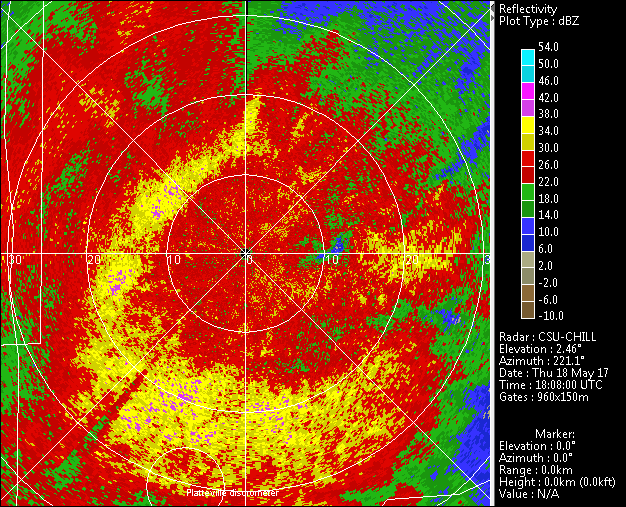
Reflectivity loop
The following loop shows the reflectivity data observed in the 1.7 degree elevation PPI scans. The time interval between the scans is slightly over 6 minutes. The organization of the high reflectivity features undergoes significant, rapid fluctuations. The presence of melting snow particles probably contributes to these localized reflectivity maxima.
|
|
||
|
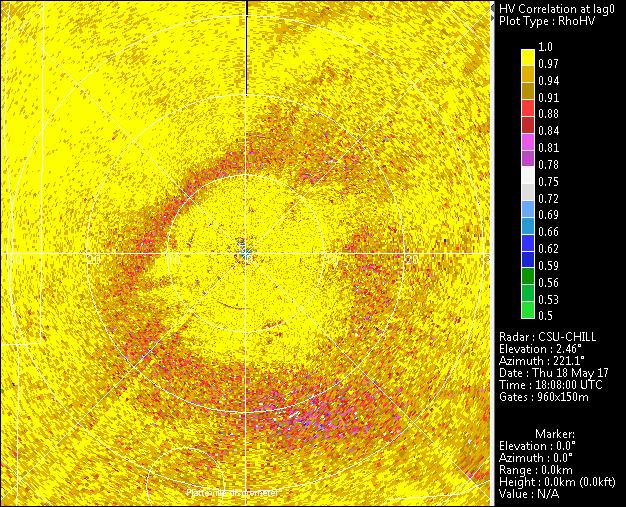
RhoHV loop
The co-polar correlation coefficient (RhoHV) field from the same series of sweeps is shown in the following loop. This correlation value is reduced when the radar pulse volume contains a wide variety of hydrometeor types, shapes, and orientation angles. This diverse particle population often exists in precipitation areas just below the 0C environmental temperature level. In this area, smaller hydrometeors rapidly melt into quasi-spherical liquid drops while the larger, more irregularly shaped aggregated snow particles are still melting. More uniform hydrometeor populations exist above the melting layer, where the particles are generally all composed of ice. Similarly, well below the melting level, all of the hydrometeors have melted into liquid drops. The net result is that the melting zone is associated with a layer of locally reduced RhoHV. In a PPI scan, this RhoHV minimum occurs at the range where the radar beam passes through the melting zone. In the case of a descending melting level, the radar range to the reduced RhoHV region will decrease with time. Such a "shrinking" RhoHV ring can be seen in the following image loop as the overall rain to snow transition occurred at Greeley. The precipitation types and observation times reported in the Greeley Airport (KXGY) AWOS A03 METAR data have been inserted in the lower portion of the image frames. Reports of unknown precipitation (UP), indicative of mixed rain and snow, generally occurred when reduced RhoHV was near the AWOS site (azimuth 160 degrees range 1.2 km from CSU-CHILL).
|
|
||
|
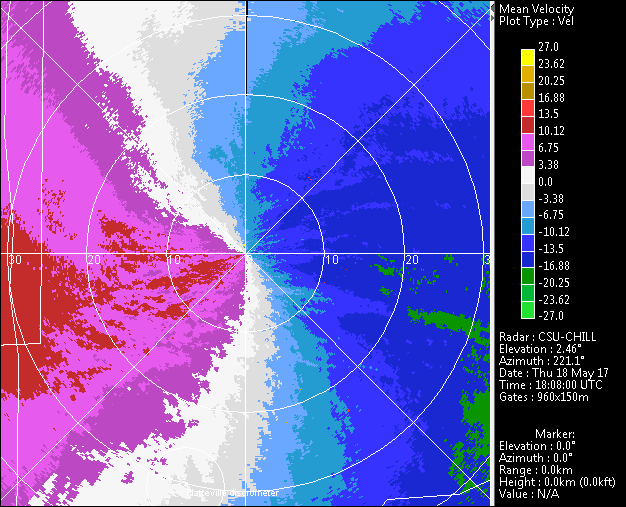
Radial velocity loop
The radial velocities in the loop time period show a general shift from easterly low level flow in the early times to northerly flow at the end. (Here low level means within the 10 km range ring.) This wind direction change can be seen by toggling between the first and last buttons on the display control. The influx of colder air associated with this northerly flow probably aided in the transition from rain to snow.
|
|
||
|
Radial velocity data in the 285 degree RHI scan
In addition to the 360 PPI scans, RHI scans on the 285 degree azimuth were periodically done. The final two panel shows the radial velocity data collected in two RHI scans separated by ~4 hours. (UTC - 6 hrs = local time). The vertical scale has been stretched, with only the first 2 km height layer being shown. On the CSU-CHILL 285 degree azimuth, clutter from the foothills of the Rocky Mountains starts to appear at ~48 km range. In the earlier (top) panel, the near 0 mps surface velocities in the first 25 km range interval are due to flow that is approximately perpendicular to the RHI plane (i.e., from 015 degrees). Above the green / white zero boundary, positive / away from the radar / upslope flow existed up to the top of the analysis region. By the later (lower panel) the general counter-clockwise rotation of the synoptic wind directions from the east towards the north is evident: Negative / inbound velocities developed near the surface at all ranges while the upslope component flow aloft weakened. In association with this reduction in terrain-induced upslope, precipitation rates slowly decreased during the evening hours. The storm total accumulations of approximately 5 inches of wet snow produced significant tree damage in the Fort Collins area. Due to the delayed transition from rain to snow, the effects of the snowfall were minimal in the Greeley area.
