DPWX/Breaking lee waves: 9 January 2017: Difference between revisions
Pat kennedy (talk | contribs) (Finalizing text.) |
m (Jgeorge moved page DPWX/Breaking lee waves: 9 January 2017. to DPWX/Breaking lee waves: 9 January 2017) |
(No difference)
| |
Latest revision as of 18:08, 29 July 2020
Author: Patrick C. Kennedy

CSU-CHILL X-band reflectivity data in a 1.8 deg elevation angle PPI scan over the portion of the Rocky Mountains located to the west of the radar site in Greeley. The precipitation echoes are due to orographically-enhanced snow produced by a strong westerly flow over the mountains. S-band data collected in RHI scans on the 285 deg azimuth showed evidence of lee waves downstream of the high terrain.
Overview
Strong westerly synoptic-scale winds flowed over the Rocky Mountains in Colorado on 9 January 2017. Upstream radiosonde data from Grand Junction, Colorado at 12 UTC on the 9th showed a temperature inversion at a level somewhat above the maximum mountain heights. This synoptic situation is conducive to the generation of mountain wave type airflows (Grubisic and Lewis, BAMS 2004, p. 1127-1142). The NWS Denver / Boulder forecast office issued a high wind warning that generally covered the western half of the CSU-CHILL radar's coverage area. The radar scanning procedures included a period of continuous RHI scans that swept the 285 deg azimuth at ~2 minute time intervals. This RHI direction sampled an area in the immediately downstream of the mountain barrier with respect to the strong westerly wind field. The S-band data collected in these scans contained layers of non-precipitation echo that appeared to be perturbed by the lee wave air motions. (Mid-level cloud bases were present in the vicinity of the radar; the Greeley airport ceilometer did not detect any clouds below 12,000 feet AGL). Starr and Browning (QJRMS, 1972 p. 73-85) have reported similar wave-tracing echoes observed with an S-band radar in the UK. They attributed these echos to Bragg scattering that developed when turbulence caused local refractive index variations to occur on spatial scales equal to one half the radar wavelength.
PPI scan data at 2058 UTC
A short period of 360 degree surveillence scans were done when the radar operations were started. The following plot shows the S-band reflectivity and radial velocity data at an elevation angle of 1.8 deg. The irregular boundary encloses the weak Bragg scattering associated with localized turbulence in the lee wave flow. (To retain this weak (~ -10 to -12 dBZ) echo, no thresholding was applied to the data). In the reflectivity data (left panel), conventional meteorological echo was received from the snow that developed as the moisture-laden pacific airmass was lifted over the mountains (i.e., beyond ~60 km range to the west of the radar). The radial velocity pattern in the right panel shows that the inbound radial velocities exceeded the Nyquist velocity (27.5 mps) in various areas of both the Bragg and snow echoes. The 1 deg width of the S-band beam pattern also caused ground clutter to appear in some of the higher terrain areas.

The next plot shows a similar presentation of the X-band data from the same PPI sweep; once again, no thresholding was applied. No evidence of the lee wave echo is seen, instead only noise indications are present in the area downstream of the mountains. Bragg scattering echoes at X-band are typically ~ 19 dB weaker than the returns received at S-band (Knight and Miller, BAMS 1993, p.179 - 188). Thus, lee wave echo was well below the X-band system's noise level. Within the precipitation echo over the mountains, the reflectivity levels observed at X and S-bands were quite similar. The narrower (0.3 deg), lower sidelobe X-band antenna pattern greatly reduced the amount of ground return in the X-band data vs. that seen in the S-band data.

S-band RHI radial velocity scan at 2111 UTC
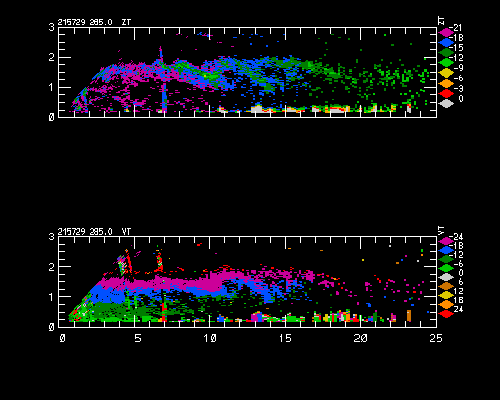
The following RHI plot shows the vertical structure of the lee wave as seen in the radial velocity data collected along the 285 deg azimuth. (The selected color scale limits result in a black band in some areas where velocity folding occurs.) The wavelength of the wave echo is ~20 km; the wave echo appears through a depth of roughly 2.5 km. This depth is similar to the maximum mountain heights. Although not shown as a plot, signal levels in some of the near-range portions of the lee wave echo were high enough meet the differential reflectivity (Zdr) signal processing threshold. The Zdr values averaged ~0 dB; this is the level anticipated from Bragg scattering (Richardson et al, JTEC, 2016, early release).

285 deg azimuth RHI loop of S-band data for the 2157 to 2229 UTC period
The following RHI image loop starts 46 minutes after the single RHI sweep shown above; the time interval between the frames is essentially two minutes. The upper panel of each plot is reflectivity and the lower panel is radial velocity. The plotted range interval has also been reduced to 0 - 25 km to provide a more detailed view of the wave structure. The wave structure during the loop period shows more fluctuations vs. the rather steady 20 km wavelength pattern seen around 2110 UTC. (The Area Forecast Discussion issued by the Denver NWS office at 2245 UTC noted that the mountain wave was showing signs of breaking down.) The reflectivity levels also increase to localized peaks of ~ -9 dBZ (yellow) during the wave breakdown process. It is speculated that the turbulence associated with the wave breakdown increases the extent of the smaller scale index-of-refraction variations that generate Bragg backscatter at S-band.
|
|
||
|