DPWX/Boundary layer outflow wind patterns on several different size scales: 11 June 2014
Author: P. C. Kennedy

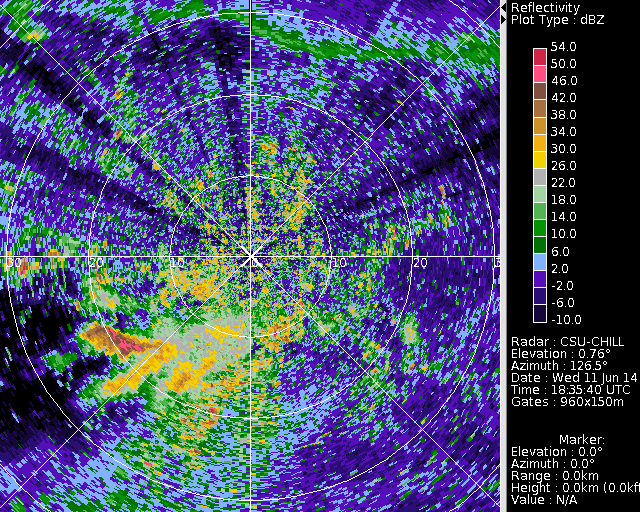
CSU-CHILL reflectivity data collected in an RHI scan through an area of virga and light rain showers located to the southeast of the radar on 11 June 2014. High time resolution, low elevation angle PPI scans showed that downdraft-related outflow from this convective activity was manifested on at least three different spatial scales.
Overview
The 12 UTC data from the sounding taken on 11 June 2014 at Denver featured a dry boundary layer surmounted by a region of greater moisture and modest thermal instability. The resultant "inverted V" temperature and dewpoint profiles are evident in the following plot obtained from the University of Wyoming archives:

Much of the precipitation from the weak showers that developed in the elevated moist layer evaporated as it fell through the underlying dry air. Areas of virga are often observed under these conditions. The following photograph shows a line of virga that was visible to the southeast of the radar at 1924:20 UTC on 11 June 2014:

The melting, evaporation, and sublimation that occur in these virga shafts combine to produce locally enhanced cooling. The resultant negative buoyancy promotes the devlopment of downdrafts and divergent surface outflows [Wakimoto 1985:1131-1143]. Between 1819 and 1929 UTC on 11 June 2014, the CSU-CHILL radar conducted exclusively low elevation angle 360 degree surveillance scans that repeated every 1.25 minutes. These scans provided high time resolution observations of boundary layer air motions that were organized on three different size scales.
Reflectivity loop
The following loop was assembled from reflectivity data collected at an elevation angle of 0.76 degrees. A fine line echo along a gust front generated by an area of dissipating thunderstorms is apparent in the northern portion of the plot domain. To the south of the radar, scattered rain showers, mostly with reflectivity levels below 40 dBZ were present:
|
|
||
|
Radial velocity patterns
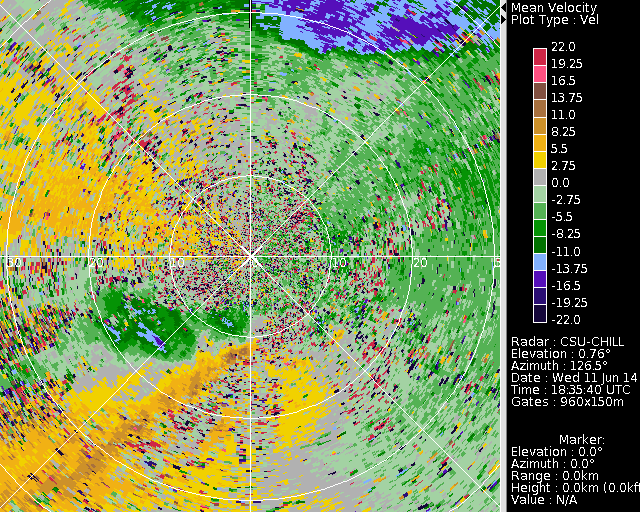
The following plot indicates the three differing scales of outflow velocity patterns that were captured during the period of low elevation angle / high time resoution scanning:

In the following image loop, the gust front, with a length scale of many tens of km, continuously propagates towards the south. Downdraft-related outflow from the showers located ~15 km southeast of the radar briefly produces a region of enhanced outbound velocities (red color shades) with a length scale of ~10 km. Finally, a divergence pattern on an initial scale of less than 5 km appears for a few minutes at a point located ~10 km southwest of the radar.
|
|
||
|
Summary
The dry boundary layer conditions that frequently occur in the high plains environment promote the evaporation of hydrometeors; the consequent cooling enhances the development of negative bouyancy and downdrafts. The interactions of these downdrafts with the underlying surface can produce wind field variations on a variety of space and time scales.
References
- [*Wakimoto 1985] Wakimoto, Roger M., 1985: Forecasting Dry Microburst Activity over the High Plains. Mon. Wea. Rev., 113, 1131–1143.
- University of Wyoming sounding archives