DPWX/Animations of RHI scans through an approaching cold pool: 8 June 2017
Author: Patrick C. Kennedy

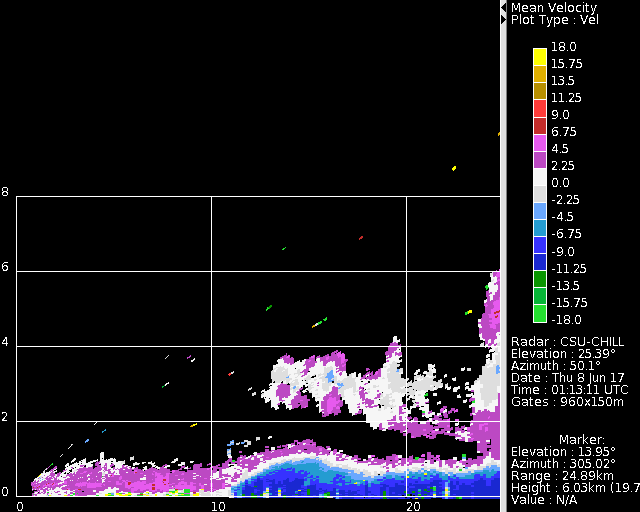
CSU-CHILL S-band radial velocities in an RHI scan through an approaching cold pool. The depth of the cold air, based on the inbound (green) radial velocities, varies in the vicinity of a convective shower. Image loops of this propagating cold pool, and some associated shower activity, have been prepared.
Overview
During the early portion of June 2017, the CSU-CHILL radar was supporting Prof. S. van den Heever's C3LOUD Ex (CSU Convective Cloud Outflows and UpDrafts Experiment) field project. As suggested by the project's name, the fine line echoes and convergent radial velocity patterns that typically occur along the surface boundaries associated with cold air outflows from thunderstorms were radar features of particular interest. During the early evening hours of 7 June 2017 (8 June on UTC), one such well-defined convergent boundary was observed approaching the radar site from the northeast. Continuous RHI scanning was started in the direction of the maximum inbound radial velocities. To increase the time resolution of the radar observations, these RHI scans contained only two sweeps: up on azimuth 049 and down on azimuth 050 degrees with a maximum elevation angle of 25 degrees. Due to this limited angular extent, the RHI volumes repeated rapidly (every 54 seconds). The following time lapse loops of this high time resolution data show several evolutionary features of interest.
The following PPI plot shows the convergence line located ~20 km northeast of the radar at 0057 UTC. The presence of two regions of darker blue shades in the inbound (negative in sign) radial velocity region indicates the presence of a second surge of stronger velocities behind the convergence line.

The corresponding reflectivity image depicts the multiple rain showers and small thunderstorms that existed to the northeast of the convergence line.

Radial velocity
The RHI animations start ~15 minutes after the time shown in the PPI plots above. In all frames, the RHI azimuth angle is 49 degrees. The inbound radial velocities are associated with the northeasterly winds in the cold, outflow air mass. Horizontal convergence is implied where these inbound velocities meet the modest southwesterly ambient flow (positive radial velocities / pink colors). The greatest cold air depth is achieved in the "head" region near the leading edge of the outflow. Subsequent undulations in the cold air depth behind the head can also be seen. The strongest inbound velocities (green colors) occur very near the surface. Since the propagation of the microwaves emitted by weather radars does not follow the curvature of the earth, radar observations made at longer ranges often completely overshoot the shallow wind speed maxima in thunderstorm outflows.
|
|
||
|
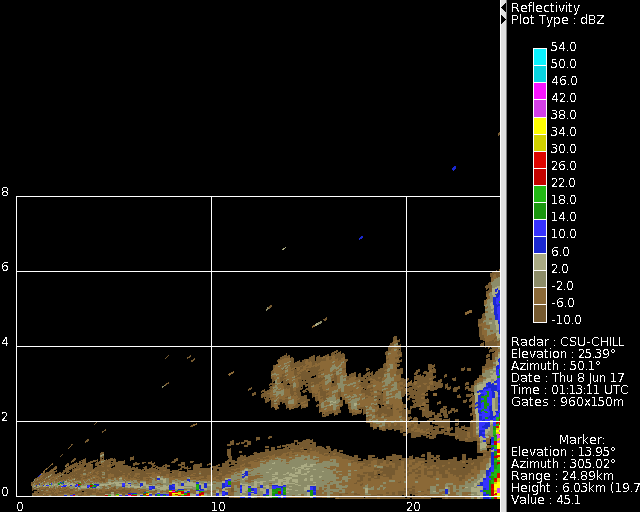
Reflectivity
The corresponding reflectivity data is shown in the next loop. The motions of the boundary layer echoes indicate the lifting that occurs in the convergent flow field at the leading edge of the cold pool. The region of elevated, initially weak echoes that follows a few km behind the advancing surface boundary is primarily due to Bragg scattering from cumulus clouds. Over the course of the loop, the reflectivity levels in these elevated echoes become stronger as hydrometeors develop aloft and descent to the surface.
|
|
||
|
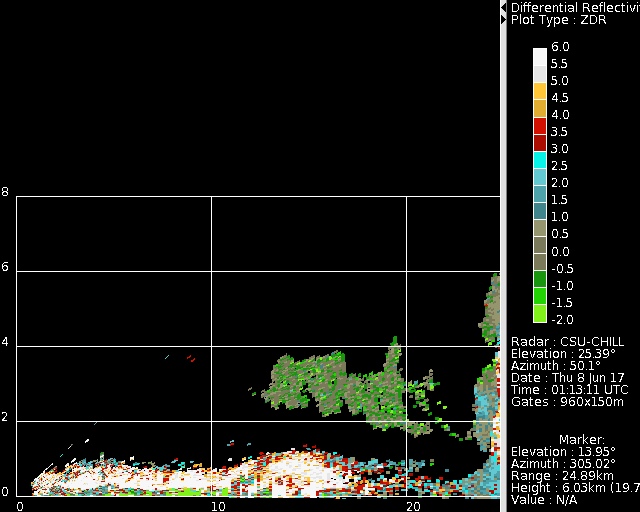
Differential reflectivity
The differential reflectivity (Zdr) values were generally highly positive (> + 5 dB) in the boundary layer echo outside of precipitation areas. This is characteristic of the radar backscatter from the highly oblate body shapes of flying insects. Modestly positive (~ +2 dB) Zdr appears in the developing rain shower when larger diameter rain drops have formed. Finally, the thin layer of enhanced Zdr that occasionally appears near 2.5 km AGL marks the melting level.
|
|
||
|
The following photograph was taken from the radar site, close to the start of the RHI image loops. The view is towards the approaching boundary. The dark layer cloud in the foreground is generated by the lift immediately along the convergence line. Deeper cumulus clouds and rain are visible at greater distances to the northeast.
