CHILL history
Why CHILL?
The original CHILL radar was assembled in 1970 using National Science Foundation funding. It was the result of a joint proposal from the University of Chicago and the Illinois State Water Survey (ISWS). The name of the radar (CHILL) was derived from the combination of the two proposing institutions, University of CHicago and the ILLinois State Water Survey. The radar construction and subsequent operations were based at the ISWS site near Champaign, IL under the direction of Dr. Gene Mueller. CHILL was deployed 25 times between 1970 and 1985 to support remote field projects at various midwest and western locations. In 1985 the radar was made an NSF National Facility which provided base funding and put the allocation and funding of remote deployments under the same mechanism used for NCAR facilities. In 1990, NSF moved the CHILL facility to Colorado State University after reviewing competing proposals from a number of universities with educational programs in atmospheric science.
The First Tornadic Hook Echo Weather Radar Observations
The first known radar observations of a confirmed tornado were made at the Illinois State Water Survey on the 9th of April 1953. Although this predates the CHILL radar, the observations were made by the same group that later developed CHILL. This section describes this notable event.
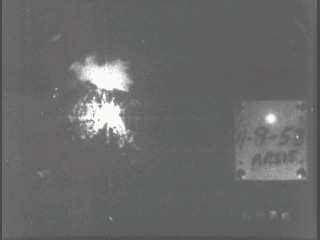
On Thursday, 9 April 1953, the first recorded radar observations of a tornadic thunderstorm were made by Mr. Donald Staggs using a research radar system operated by the Illinois State Water Survey (ISWS) at Champaign. Mr. Staggs, an electrical engineer, was testing the radar in preparation for an upcoming field project. He recognized the intriguing nature of the echo patterns that were being detected late that afternoon and voluntarily continued the radar operations into the evening hours. Some of the resultant data were included in several 16mm motion picture films that were produced at the Water Survey in the 1950's. The images collected on this web page have been extracted from digitized versions of the original ISWS movies.
The radar used for these observations was an APS-15A that had originally been designed as an airborne surveillance system installed aboard US Naval aircraft during World War II. To support rainfall estimation studies, engineers at the Water Survey modified the APS-15 so that the receiver gain could be stepped through a series of pre-set sensitivity levels. The antenna made continuous sweeps at a single fixed elevation angle of ~0 degrees. A 35 mm camera automatically recorded the Plan Position Indicator (PPI) display during each complete 360 degree antenna revolution. Some performance characteristics of the Water Survey radar are summarized below
| Property | Value |
|---|---|
| Wavelength | 3 cm |
| Antenna Diameter | 36" |
| Antenna Beamwidth | 3° |
| Peak Transmit Power | 35 kW |
| Pulse Width | 2 μs |
| Min. Detectable Signal | -97 dBm |
| Recorded Data | B/W photographs of PPI scope, displaying returned power level (without range normalization) |
At the time of the hook echo observations, the APS-15 was mounted on an approximately 50 foot high tower next to the ISWS quonset hut at the University of Illinois - Willard Airport (CMI).

The thunderstorm of interest moved generally from west to east along a path that passed a short distance north of the radar. As the storm emerged from the ground clutter pattern north of the radar, an appendage on the right rear flank of the parent echo became visible. Range rings are at 10 nm / 18.5 km intervals.

Within a few minutes, this echo appendage began to curl into a hook shape.

As the cyclonic curl-up process continued, a weak echo "eye" could be seen at some receiver gain settings

The width of the hook echo increased as the storm moved away towards the northeast. An attenuation "notch" became more evident due to the heavy rain and hail that was falling within the parent echo

Time-lapse
|
|
||
|
Tornado Images
The tornado was visually well-defined as seen from the vicinity of Royal, Illinois (located near an azimuth of 060 degrees and a range of 16 nm).


Initial Analysis
The tornado produced by this thunderstorm caused two fatalities. During the two months following this event, destructive tornadoes also took place at Waco, Texas (5/11/53; 119 fatalities), Flint Michigan (6/8/53; 115 fatalities), and Worcester, Massachusetts (6/9/53; 94 fatalities). Thus, the ISWS 4/9/53 data were of considerable research interest for studying the relationships between radar echo features and tornadoes. To quickly disseminate the images of the tornadic echo, Stout and Huff initially published them as an item of correspondence in the June, 1953 issue of the Bulletin of the American Meteorological Society (Vol 34, No 6, pp 281-284). Later, a more through analysis of the ISWS radar data was published by Ted Fujita in a 1958 Journal of Meteorology article (V15, pp288-296). Two figures from this paper are shown below. Fujita developed these figures by manually tracing 280 individual frames of the PPI photographs taken at the various receiver gain steps.


Summary
The technology of radar detection of severe storms has advanced considerably in the past five decades. Some of the cornerstones of this progress were provided by the ISWS data collected on 9 April 1953.
Acknowledgments
ISWS
Dr. Derek Winstanley, Chief of the Illinois State Water Survey kindly permitted this use of their motion picture data
The radar images were taken by scientists of the Illinois State Water Survey, located in Champaign, IL, as part of a 50-year long program in weather radar research and development.
CSU
Kevin Beard of the CSU Instructional Services Office converted the 1953 images into digital video format, and Jim George of the CSU-CHILL radar facility developed the image loop software. Technical information on the APS-15 radar was given by Gene Mueller, retired ISWS and CSU-CHILL engineer.