Antenna Pattern Evaluation
A 9-meter dual-offset Gregorian antenna was installed in the spring of 2008 at the CSU-CHILL radar facility to upgrade the performance from the center-fed parabolic reflector previously used at the facility. The new antenna design has several advantages over the old antenna, primarily eliminating beam blockage by using an offset-feed structure and reducing cross-polarization with a dual-reflector design. The antenna pattern was measured in the summer of 2008 by REU student Michael Wood, the results of which are presented in this article.
Experimental Setup

In order to experimentally determine the pattern of the new CHILL antenna, a standard gain horn was used to emit a continuous signal in a nearly single polarization at 2.725 GHz. This signal was received and processed by the antenna and both co-polar and cross-polar powers were recorded in a set of data files.
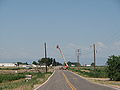
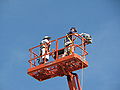
In order to obtain the far field antenna pattern, it was necessary to place the horn at least 1300 m from the antenna and at the highest elevation angle possible. After being unable to find a usable existing test site, a 19 m boom lift was rented and placed near the Greeley airport at a range of 1488 m from the antenna. The figure shows the fully extended lift as well as the CHILL radome in the lower-left. The test site was at an azimuth of 146.75° and elevation of 0° from the antenna. Bob Bowie and Michael Wood were in the lift to put the horn in the proper orientation while Dave Brunkow, Jim George and Pat Kennedy collected data and ran the necessary scans from the CSU-CHILL site.
Standard Gain Horn Setup
An S-band standard gain horn is used to radiate the test signal needed for the antenna pattern measurements. The horn has a beam width of roughly 7 degrees.

An Agilent N5181A MXG signal generator is used to generate a 2.725 GHz signal. To ensure a steady power output from the horn, a microwave bridge was connected between the horn and signal generator so an Agilent E4418B power meter could record the power through the bridge. Before conducting the pattern measurement, the bridge was calibrated using a network analyzer. Throughout the experiment the power meter read -16.9 dBm, indicating that the power through the horn stayed relatively constant and also giving a power loss in the cable of 0.5 dB after taking into account a 16.4 dB loss from the bridge.

The horn is mounted on a modified theodolite base, which permits the horn to be accurately rotated in azimuth, elevation and also about the beam. Spirit levels on the theodolite base permit accurate levelling of the horn relative to the earth. Power is coupled into the horn through a waveguide to coax adapter. The experimental setup is shown to the right, as mounted on the boom lift.
Setup Procedures
In order to properly orient the standard gain horn, the horn is rotated in azimuth to maximize the co-polar power received at CHILL. Once this was done, the horn was rotated about the beam direction, while monitoring both the received co-polar and cross-polar signals at the radar, to obtain the highest ratio of cross-polar to co-polar power. Once the horn was put in place it, was kept fixed for all tests at that polarization. In this manner, co- to cross-power nulls down to -45 dB were observed.
Data Collection
With the horn properly oriented and its output power monitored, raster scans and principle plane measurements were run to determine the antenna pattern of the CHILL antenna. The raster scan ran from ±20 ̊ in azimuth and -0.4 ̊ to 10 ̊ in elevation to obtain power values near the boresight while a 360 ̊ azimuth scan and -0.4 ̊ to 90 ̊ elevation scan were run along the boresight.
Data Analysis
Data from the antenna pattern measurements was saved as binary files corresponding to each scan performed by the system. Using the archdump program, these binary files were converted into text files containing the necessary information. For this project azimuth, elevation, vertically polarized power and horizontally polarized power were extracted from the binary data and saved into text files for easier processing in MATLAB.
Results
The results from MATLAB are plotted for the various polarizations and cuts of the pattern. The zero and 90 degree cuts could be directly plotted by having the radar antenna positioner perform PPI and RHI scans. The positioner cannot, however, rotate the antenna about boresight, so the 45 and 135 degree cuts are plotted from interpolated data.
0 degree cut

Vertical Polarization, showing both co- and cross-polar patterns.

Horizontal Polarization, showing both co- and cross-polar patterns.
45 degree cut


Vertical Polarization, showing both co- and cross-polar patterns.


Horizontal Polarization, showing both co- and cross-polar patterns.
90 degree cut

Vertical Polarization, showing both co- and cross-polar patterns.

Horizontal Polarization, showing both co- and cross-polar patterns. The "Simulated" data is from a simulation based on the dimensions and geometry of the antenna. The "Old" data is from the center-fed antenna previously used on CHILL.
135 degree cut


Vertical Polarization, showing both co- and cross-polar patterns.


Horizontal Polarization, showing both co- and cross-polar patterns.
Raster Scans
| Vertical | Horizontal | |
|---|---|---|
| Co-polar | 
|

|
| Cross-polar | 
|

|
Conclusions
The pattern measurements were largely successful, with an unprecedented cross-polarization isolation in excess of -45 dB measured. The end results of creating these patterns and providing a comparison to the old antenna are the ability to ensure that the antenna was properly integrated on site and to see performance improvements from the old antenna.
Both the sidelobe and cross-polar specification given to the antenna’s manufacturer have been met with the exception of the 0° cut.
The two expected areas of performance increase were in reduced sidelobe levels and reduced cross-polarization, especially at the boresight. The reduced sidelobe levels are seen in three of the four cuts compared. While evidence from the cross-polar patterns is not as conclusive, it is clear that the levels are at worst similar to those of the old antenna. In addition, these measurements are impacted by the noise floor, which is near most of the actual cross-polar measurements. A more detailed pattern test is the only procedure that could improve the measured cross-polar data and see a better performance improvement over the old antenna.
Acknowledgements
The CSU-CHILL staff wish to thank Michael Wood for his work on making these antenna pattern measurements and to compile the figures and images shown in this article. Michael completed this work in the summer of 2008 as a part of the Research Experience for Undergraduates (REU '08) program, sponsored by the National Science Foundation.
Image Gallery
-
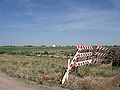
View of CSU-CHILL from the measurement site
-
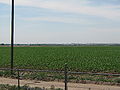
View of the measurement site from CSU-CHILL
-
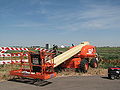
Boom lift with standard gain horn
-
Extended Boom lift
-
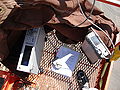
RF Measurement instruments on the boom lift
-

Michael Wood performing measurements atop the boom lift
-
Bob Bowie and Michael Wood at the measurement site
-
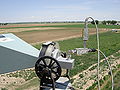
Standard Gain Horn Setup


