ASP lab textbook examples: 2 July 2008
Introduction
Precipitation systems often present a number of characteristic signatures when viewed by dual polarization S-band weather radars. This bookmark presents examples of many of the primary radar features observed in several precipitation regimes.
Reflectivity ()
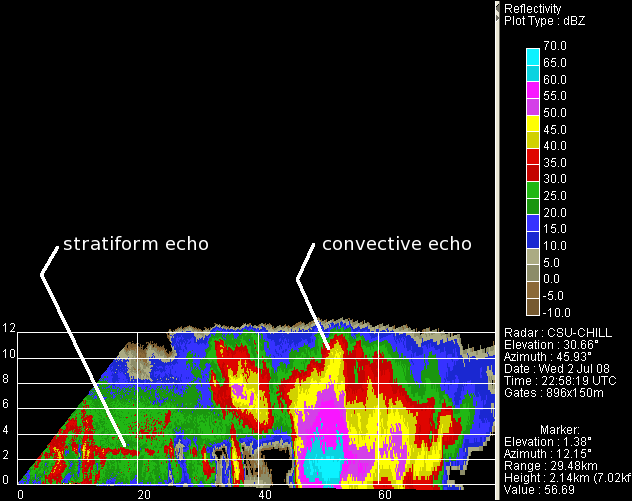
The following RHI scan was taken through a precipitation area located east of the radar. In the vicinity of the 20 km range mark, a horizontally oriented layer of enhanced reflectivity (the "bright band") is present near the 2.8 km AGL height level. This echo enhancement occurs due to melting as precipitation particles descend through the 0°C level. As melting occurs, the refractive index of the particles changes from that of ice to that of water. For S-Band radars, this change amounts to a factor of ~3 which causes a reflectivity increase on the order of 4 - 9 dB. Also, the wetness that develops on the outer surfaces of the particles makes them more likely to stick together when they collide. The resultant aggregates also raise the reflectivity due to their large diameters.
Once the frozen particles fully melt and collapse into raindrops, their aerodynamic drag decreases significantly. This causes the drops to accelerate downward away from the melting zone. This locally decreases the particle concentration which tends to reduce the reflectivity. The bright band is a commonly observed element in stratiform precipitation where vertical air velocities are small. (It should be noted that stratiform precipitation can occur without a well defined bright band; see Martner et al, J. Hydrometeorology, June 2008).
Convective precipitation is occurring in much of the area beyond ~30 km range. The stronger vertical air motions in this area produce reflectivity contours that are quasi-vertically aligned and cause significant reflectivity values to extend to the tropopause. Maximum reflectivity levels reach ~60 dBZ, approximately 30 dB (or a factor of 1000) times greater than the signal intensities observed in the stratiform echo area.
Differential Reflectivity ()
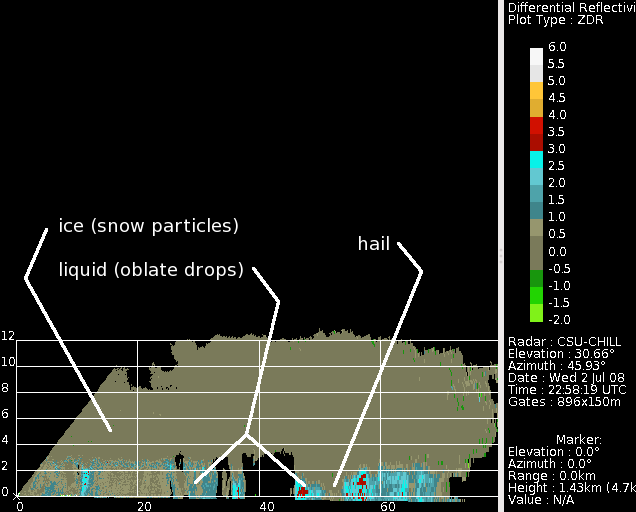
The height of the melting level is approximately indicated by the altitude at which positive values begin to appear in the stratiform region. Below the melting level, the hydrometeors in this area have fully melted into liquid drops; the force balance on these drops deforms them into oblate spheriodal shapes. On average, the long axis of these drops maintains a quasi-horizontal orientation. Thus their diameter in the horizontal plane exceeds that in the vertical plane. This leads to a positive value since is based on the H/V received signal strength ratio. The larger ice particles that exist above the melting level generally have irregular shapes and relatively low bulk densities due to entrapped air. These factors tend to equalize the H and V returned signal level, producing near 0 dB values. (Recall that is measured on a log scale, so an H/V power ratio of one translates into a of 0 dB).
An additional region of ~0dB extends to the ground in the high reflectivity core at a range of ~50 km. Hailstones are generally more spherical than raindrops and undergo large amplitude gyrating motions as they fall. These factors tend to cause similar received H and V powers, producing near 0 dB 's. These low values contrast sharply with the surrounding positive rain areas.
Differential Propagation Phase ()
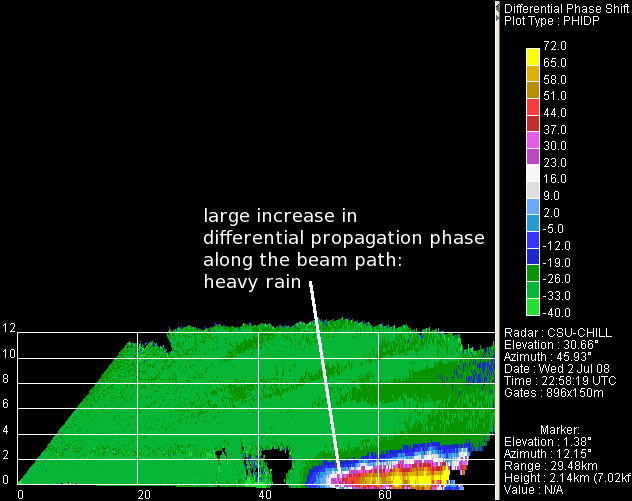
The horizontally and vertically polarized radar pulses undergo different phase variations as they propagate through oriented particles along the beam path. A large concentration of horizontally-oriented particles will result in a phase retardation of the H wave with respect to that of the V wave. Thus, , the measured difference between the phases of the received H and V signal returns, provides an indication of the existence of appreciable concentrations of preferentially orientated, non-spherical particles along the radar beam path. The amount of differential propagation phase shift is judged by the extent of the color change that develops along the various beam paths.
In this RHI, the phase lag between the H and V signal returns begins to increase at a range of about 47 km. Between 47 and 60 km phase difference increased by ~70° (-12° to +60°). This rapid increase in H wave lag per range increment implies the existence of a large concentration of oblate (i.e., large) drops, indicating a high rain rate. (Rain rate estimates can be made from the range derivative of . This phase- based measurement is free of the radar system calibration uncertainties that affect conventional reflectivity-based rain rate estimators).
Co-polar Correlation between the H and V Returned Signals ()
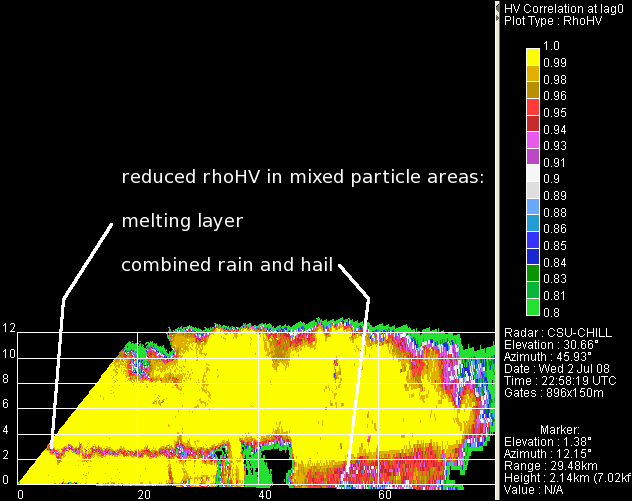
The degree of correlation between the H and V signal returns is reduced when a variety of hydrometeor shapes, sizes, and orientations are present in the pulse volume. Within the stronger, adequate signal to noise ratio regions of the echo, regions of reduced values are found primarily in two areas:
- In the bright band melting layer where fully melted, quasi-spherical drops co-exist with ice particles of various sizes and shapes. Note that correlation values approach 1.0 in the areas well above the bright band where the hydrometeor types are more uniform (i.e, all rain or all snow.)
- In much of the convective precipitation region where residual ice particles are mixed with the rain; the lowest values in this area occur where the hail is mixed with the rain.
Linear Depolarization Ratio (LDR)
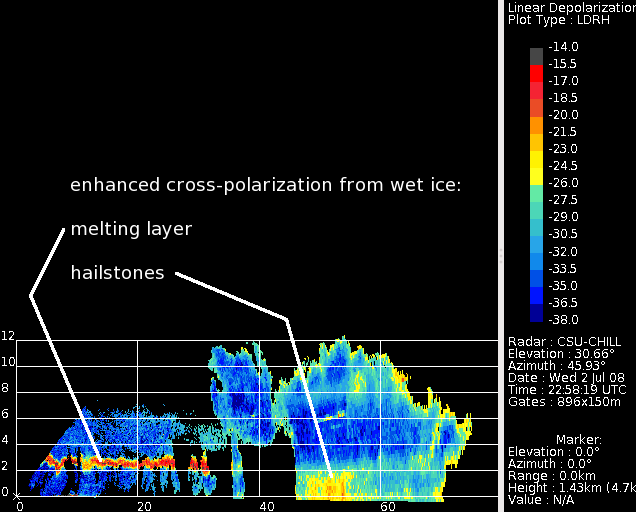
The linear depolarization ratio is a comparison of the power that has been backscattered into the cross-polarization sense with respect to the co-polar received signal power. his transfer of power from the co-polar to the cross polar channel is maximized when non-spherical scatterers reach orientations where their major axis becomes inclined 45 degrees with respect to the horizontal. These particle shape and orientation effects are most strongly expressed when the refractive index magnitude approaches that of water. Strong linear depolarization conditions are generally best realized when wet-surfaced, irregularly shaped ice particles are present. Conversely, LDR is minimized when only spherical particles, like drizzle drops, are present.
In the example RHI shown below, the highest cross-polarization levels are seen in the melting layer and in the hail area near the surface. Wet, asymmetrical, wobbling ice particles are present in both of these regions.
References
Martner, B.E., S.E. Yuter, A.B. White, S.Y. Matrosov, D.E. Kingsmill, and F.M. Ralph, 2008: Raindrop Size Distributions and Rain Characteristics in California Coastal Rainfall for Periods with and without a Radar Bright Band. J. Hydrometeor., 9, 408–425.


