X-Band Kdp observations in a snowstorm: 3 February 2012

Areas with significant X-Band differential propagation phase shift located in the vicinity of the -15° C environmental temperature level were noted during a heavy snow event on 3 February 2012. Preliminary plots from the first several hours of this storm have been prepared.
Introduction
During the 2 - 3 February 2012 period significant snowfall occurred in portions of the CSU-CHILL coverage area. This precipitation system provided an opportunity for additional test data collection with the radar operating in dual frequency (both S and X-Band) mode. The snowfall was due to a well-developed, synoptic scale upslope pattern. The color fill in the following plot shows the terrain height in the CHILL area. (Units are decameters; 120 = 1200 m above sea level). Low level air with an east to west motion component will experience lifting as it impinges on the rising terrain to the west of the radar.

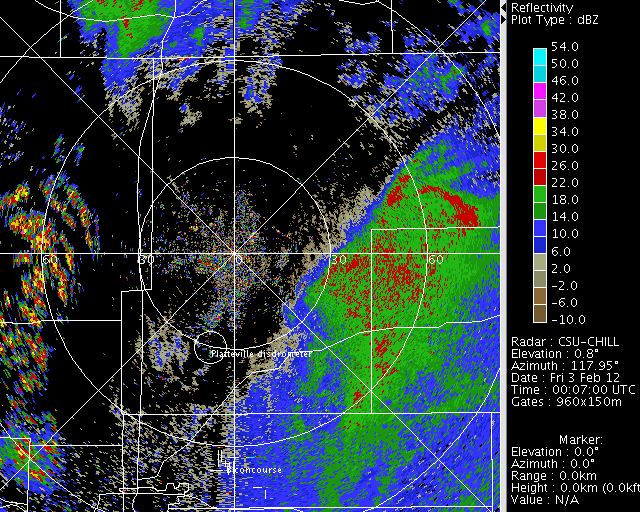
S-Band reflectivity loop at 0.8° elevation angle
The following loop shows the evolution of the S-band reflectivity field in a series of 0.8 degree PPI scans done at 10 minute intervals between 0006 and 0656 UTC. The low level echo coverage generally fills in during the early portion of the loop. The westward motion of the reflectivity features is also evident.
|
|
||
|
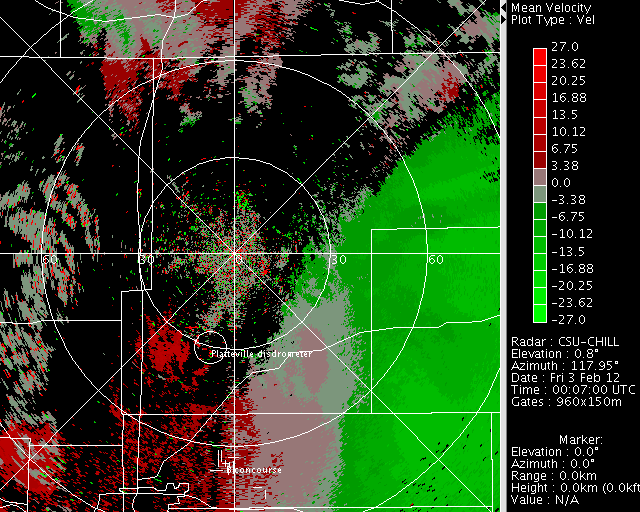
S-Band radial velocity loop at 0.8° elevation angle
The S-Band radial velocity pattern in the 0.8° PPI scans is shown in the next loop. The clockwise rotation of the 0 mps line near the radar reflects the shift in the low level wind direction from the north to the northeast that took place between frames 16 and 21 (0244 and 0351 UTC). Wind speeds also tended to increase with time after ~04 UTC.
|
|
||
|
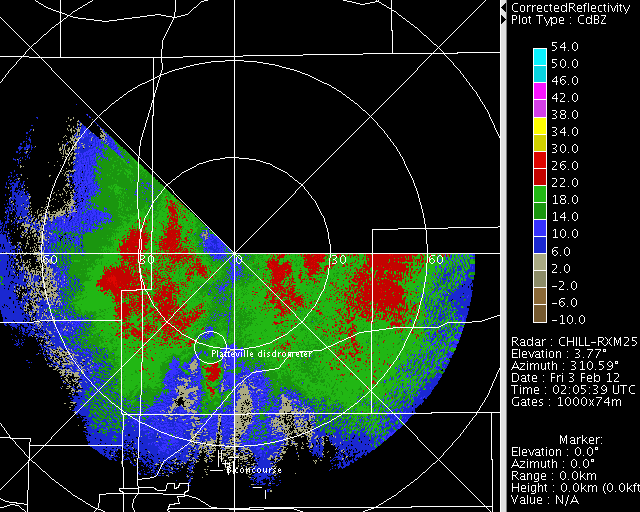
X-Band corrected reflectivity loop at 2.8° elevation angle
Following the single 0.8° full 360 PPI scan, a wide sector scan was done at a series of higher elevation angles. The following loop shows the X-Band attenuation-corrected reflectivity data in the 2.8° PPI sweeps between 0205 and 0640 UTC. (The elevation angle shown in the annotation block exceed 2.8° because the antenna had starting moving up to execute the next sweep.) Reflectivity enhancement occurred over the foothills of Larimer and Boulder Counties in the northwest and southwest azimuth quadrants from the radar.
|
|
||
|
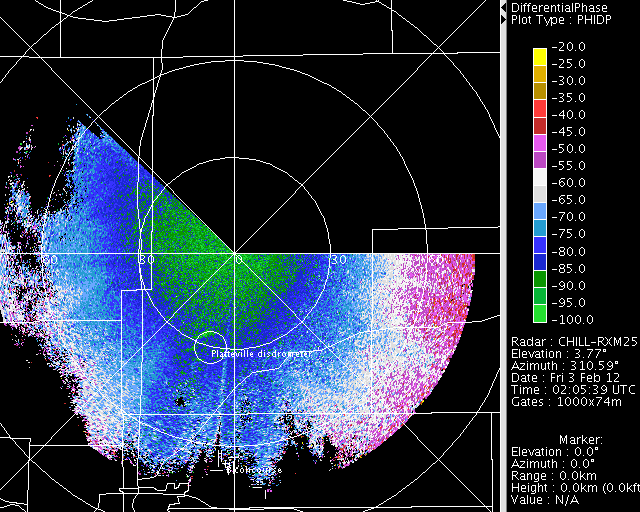
X-Band differential propagation phase loop at 2.8° elevation angle
The evolution of the X-Band differential propagation phase (phidp) field on the 2.8° PPI surface is shown below. Range intervals over which the color sequence moves up the color scale indicate that the presence of a significant concentration of horizontally-oriented ice particles is retarding the propagation of the H polarized waves relative to the V waves. Patchy areas of enhanced phase shift occurred in association with the reflectivity maxima that were passing to the south of the radar. Somewhat more persistent high phase shift areas occurred in the region of forced lifting above the foothills.
|
|
||
|
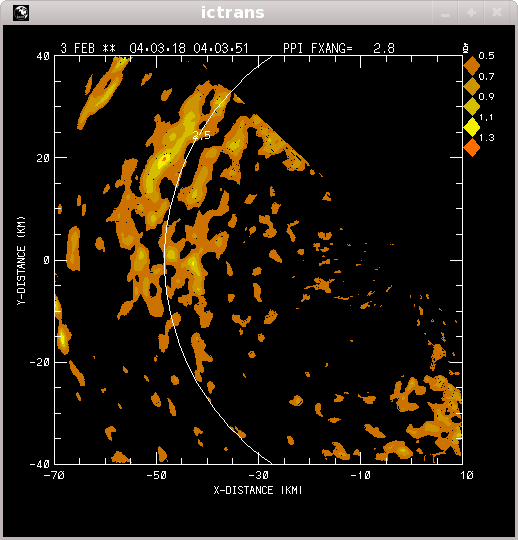
X-Band specific differential propagation phase loop at 2.8° elevation angle
Specific differential propagation phase (Kdp) is the derivative of phidp with respect to range. The Kdp values shown in the following loop were calculated after a series of spatial smoothing filters were applied to the raw phidp data. Peak Kdp values approaching 2 degree/km were observed. Since Kdp is inversely proportional to the radar wavelength, the magnitudes are several times larger than those observed at S-Band (Kennedy and Rutledge, 2011 JAMC, 844-858). These peak values also tended to occur near 2.5 km AGL (3.9 km MSL) height ring. Based on the DNR sounding data from 00 and 12 UTC on 3 February, the temperature remained within +/- 1° C of -15° C at this height level. It is suspected that the vigorous growth of dendritic ice crystals at this temperature level in the terrain-induced updrafts contributed to the large Kdp magnitudes. The greater phidp sensitivity offered by X-band as compared to S-Band will be useful in future studies of the evolution of precipitation particles and cloud electrification.
|
|
||
|
References
- Kennedy, Patrick C., Steven A. Rutledge, 2011: S-Band Dual-Polarization Radar Observations of Winter Storms. J. Appl. Meteor. Climatol., 50, 844–858.