Transformation of CHILL to the VCHILL Era
This article describes the architectural changes introduced by the signal processor/radar controller, and how the CSU-CHILL radar is brought into the modern era through the VCHILL initiative.
Introduction
The CSU-CHILL S-band dual polarized pulsed Doppler weather radar was initially jointly developed by the University of Chicago and the Illinois State Water Survey, and was moved to the present site in 1990 [1]. Since its construction, the radar has undergone several upgrades and developments, including the addition of dual polarization capabilities, a new reflector antenna, a second transmitter and receiver chain [2] and a digital-IF receiver and Lassen DRX high-speed processor [3]. Each of these improvements have enhanced the radar’s capabilities and has made it a high-quality research facility to support cutting edge research in atmospheric remote sensing.
In recent years, the radar has undergone a series of planned upgrades under the Information Technology Research (ITR) program, through the Virtual CHILL (VCHILL) initiative [4]. This project aims at transforming the CSU-CHILL radar, bringing it up to the forefront of remote accessibility and operation. Under this project, all aspects of the radar operation are brought under computer control, which allows for easy and quick changes to the operating state of the radar.
An important aspect of the VCHILL project is to enable fast, agile development work through the use of well-known development tools and hardware, minimizing the steep learning curve typically faced when working on a radar system. Finally, the use of advanced digital hardware ensures that both the initial as well as operational and maintenance (O&M) costs of the radar are minimized. As a part of this upgrade, the performance characteristics of the radar have been improved. The driver for these improvements requirements for improved signal processing algorithms such as clutter suppression and second trip suppression.
Overview
The goal of the VCHILL Initiative is to transform the CSU-CHILL radar to the modern era of virtual operation. This opportunity was also used to enhance the base characteristics of the radar for various advanced applications and to enable the VCHILL concept, and several new capabilities and features were added. This article describes the key aspects of the transformation of CHILL. The primary goal of the transformation was to enable easy implementation of advanced radar operation concepts such as coding of transmit waveforms, modern clutter suppression techniques as well as spectral processing, without performing extensive changes to the system or rebuilding sub-systems. In addition as facility that supports cutting edge research the transformation if done right should be ready to test concepts in weather radar that are yet to be invented. There are examples in the end of this article of a variety of applications enabled by this transformation. Of course with the whole system riding on the VCHILL platform, these advances are readily available to researchers all over the US and in fact all over the world. This VCHILL transformation has been a trend setting transformation that such features are being demanded routinely in modern weather radar systems.
The figure below shows a block diagram of the CSU-CHILL Radar, highlighting the new developments under the VCHILL scheme:

Block Diagram of the CSU-CHILL Radar System
A digital transmitter control system was designed, evaluated and installed. This subsystem permits the CHILL dual-Klystron transmitters to be remotely controlled by computer.
The transmitters are complemented by a new Digital Receiver system. The digital receivers use off-the-shelf parts and programmable logic to perform digital downconversion and filtering. The digitized data samples are made available on a Gigabit Ethernet LAN, for further processing.
The output of the digital receiver is processed by the CHILL Signal Processor system. The signal processing algorithms run on off-the-shelf hardware, allowing a quick development-to-deployment cycle.
In order to view the output of the digital receivers in real-time, a suite of display software was written, which permits users to view the data via a network connection. The networked nature of the software permits the display and control functions to be physically separate from the radar.
Digital Transmitter
Main article: CHILL Transmitters

The CSU-CHILL Radar uses dual Klystron power amplifiers, capable of generating upwards of 1 MW RF power per channel. The Klystrons are capable of amplifying waveforms with sophisticated modulation both within the pulse as well as between successive pulses. In order to take advantage of this ability, a digital waveform generator board was constructed, which can synthesize a variety of waveforms under computer control.
The waveform generator is capable of generating two modulated waveforms at a programmable IF (nominally, 50 MHz), with a waveform table that can be downloaded from a host computer. The waveform table contains I/Q sample pairs, sampled at a 10 MHz rate. Waveforms can change on a pulse-by-pulse basis, offering inter-pulse waveform modulation. The waveform can also be modulated within a pulse to perform pulse-compression effects.
The primary frequency reference for the waveform generator is a GPS-disciplined oscillator. This permits a high frequency accuracy, and also phase-locks the radar to the GPS satellite constellation. Thus, other radars of the same design, such as CSU-Pawnee, may operate in a phase-locked bistatic mode.
The figure below shows a block diagram of the complete transmitter controller. This includes the Waveform Generators, and a programmable trigger generator. The trigger generator provides multiple trigger signals, which are used to trigger the transmitter HVPS and the digital receiver.

CSU-CHILL Transmitter Controller Block Diagram
A gallery showing four of the many possible waveforms is shown below:
-
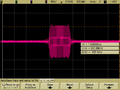
Rectangular Pulse
-
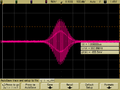
Gaussian Pulse
-
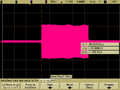
Linear Frequency Modulated Pulse
-
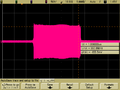
Nonlinear Frequency Modulated Pulse


The digital transmitter controller is in routine use at CHILL, where it is used to generate low sidelobe waveforms for the transmitter. This is illustrated in the figures below. Part (a) shows the transmitter without any waveform shaping (the older system). Note the presence of extended sidelobes in the frequency domain. Once waveform shaping is introduced, the sidelobes are dramatically lowered, as shown in part (b).

|

|
| (a) Rectangle drive waveform | (b) Gaussian drive waveform |
Klystron Output
Digital Receiver
Main article: CHILL Receivers

The CSU-CHILL digital receiver is a dual-channel coherent-on-transmit type, with a total of four digitizer channels. Two channels are connected to a transmitter sampling port, while the other two are connected to the LNA/downconverters. A commercial off-the-shelf board, the ICS-554E from ICS/Radstone/GE-Fanuc
The IF signals from the downconverters is directly digitized by two 14-bit ADCs at a sampling rate of 40 MHz. The digitized signals are brought in to an FPGA on the digitizer board. The Xilinx XC2V3000E FPGA is programmed to perform digital downconversion to baseband. The baseband digital signals are then low-pass filtered in two steps, with either the intermediate or the final results being made available. This permits the bandwidth and sampling rate to be selected.
The FPGA on the ICS-554 is also interfaced to the radar hardware through an interface board. In this manner, the FPGA has access to the radar triggers, the antenna position and GPS time-codes.
The FPGA is also programmed to packetize the data, and apply a timestamp, antenna position and trigger information to each packet. This permits the processing software to have the most accurate information available about the radar's current operating state.

CSU-CHILL Digital Receiver FPGA Block Diagram
The ICS-554 digitizer board is hosted by a Linux PC, using a PMC-to-PCI adapter board. The data is read over the PCI bus, and is made available by the host machine over a TCP/IP Gigabit LAN.
Signal Processor
Main article: CHILL Signal Processor
The signal processing to extract meteorological data from the received radar data is performed on off-the-shelf PCs, running the Linux OS and the CHILL Signal Processor suite. The signal processing server reads the time-series (I/Q) data from the digital receiver host and processes this data to yield meteorological data, including polarimetric variables. All data in and out of the signal processor is through the use of Gigabit Ethernet.
The figure below shows the networked architecture of the radar signal processor.

Networked Radar Architecture
The signal processing system also writes both the processed as well as the unprocessed data to a disk archiver. Unlike previous signal processors, the CHILL processing system is capable of writing time-series data to disk while at the same time, process the full set of 1000 or more range gates. The system is only limited by the total network capacity to carry the data.
The main benefit of the networked CHILL signal processor is its use of commercial off-the-shelf computer hardware and the Linux-based software. The software development tools used under Linux are mature, and well known to most users of the radar. This permits updates, and addition of new capabilities to occur at a rapid pace. Moreover, the time-series archive capability is useful to developers, since the data from the radar is available in its most basic form for the signal processor. New algorithms can be tested offline before they are implemented in real-time with live data from the radar.
Display Software
The software suite used on the CHILL radar is expected to form a complete radar system package, capable of handling the needs of data collection projects, including trouble-shooting tools and packages. Keeping this in mind, a suite of display and control programs were written, with a common network protocol designed to permit easy communication between the different pieces of software.

The Engineering Display program is designed for real-time viewing of the signal processor output. A hole-free scan-conversion algorithm permits a high quality display to be generated from the received data. Interactive features, such as zoom and pan, are available to the user. Users are presented with a base map and overlay, permitting geo-location of the display data. The program includes a color-table editor, and can display data using a variety of smoothing methods.
The signal processor is, of course, compatible with the Java VCHILL client, permitting users of all operating systems to view the data output from the signal processor.
Examples of the Signal Processor's Capabilities
This section illustrates some of the applications of the CSU-CHILL radar that take advantage of the the new capabilities of the new digital transmitter controller, digital receiver and signal processor.
Whitening
The variance of parameters estimated by a weather radar, such as reflectivity and mean velocity, are affected by several factors such as the spectrum width of the observed volume and the observation time. The variance may be reduced by averaging together several measurements, with the assumption that the measurements are independent[5]. The highly correlated nature of the oversampled signals cause the total number of independent samples to be less than the actual number of samples used in the estimation. Whitening is a signal processing technique that may be used to decrease the correlation between the subsamples by multiplying them with a decorrelation matrix [6].
Previous works [7][8] that have applied signal whitening to data from the CSU-CHILL radar have noted that the variance of polarimetric parameters such as differential reflectivity ( ), differential phase shift ( ) and copolar correlation coefficient () are adversely affected by application of whitening transformations to signals from each polarization. Moreover, suffers from bias after applying whitening. This occurs due to the unique nature of the CSU-CHILL radar transmitter, which uses separate Klystron power amplifiers for each channel. Phase variations in the channels resulting from imperfect matching between the Klystrons modulate the echo signals received on each polarization channel.


The digital transmitter controller is used to overcome this effect by compensating for the variation in phase within the transmitter pulse. The results of applying whitening to the corrected transmitter pulses is shown in the figures below. It is noted that the bias in is reduced compared to data processed from the previous CHILL signal processor. In addition, the variance in polarimetric variables is seen to decrease.

|

|
| (a) Scatterplot of polarimetric variables processed with Whitening. DRX data courtesy Erich Hefner. | (b) Range Profile of Standard Deviation of Polarimetric Variables. Data is obtained from 25 to 35 km by CSU-CHILL |
Results from Whitening Processing on CSU-CHILL data
Spectral Decomposition
This is a technique to spectrally classify the radar signal into weather signal, noise and ground clutter. Once the signal is classified, the weather signal component alone may be used to estimate the spectral parameters, allowing the ground clutter and noise effects to be minimized.
The copolar coherency spectrum, is defined as


where is the co-polar cross spectrum and , are the horizontal and vertical power spectra, respectively. The co-polar cross spectrum and power spectra are estimated using the Welch method. The co-polar cross spectrum is the spectral decomposition of the co-polar correlation coefficient, . In order to reduce the variance of , and , the spectra are computed from oversampled data, and the power spectra from subgates are averaged together.


The spectral decomposition of differential phase, . At low elevation angles, the spectral differential phase is independent of Doppler frequency for a precipitation signal. The spectral differential phase of ground clutter, however, was observed to vary with Doppler frequency and range.

Spectral decomposition of differential reflectivity, is defined as the ratio of the horizontal and vertical co-polar power spectra . of precipitation signals is also observed to be independent of , while that of ground clutter varies with both and range.


By examining the local standard deviation (also known as texture analysis) of the spectrograms and , we can obtain a spectral filter to reject ground clutter and noise. The subscript refers to the Doppler frequency bin and is the range. The expression for the local standard deviation of the variable with an neighbourhood is


![{\displaystyle \mathrm {SD} \left\{x(v,r)\right\}={\sqrt {{\frac {1}{N^{2}-1}}\sum _{j=-K}^{K}\sum _{i=-K}^{K}\left[x(v+i,r+j)-{\bar {x}}(v,r)\right]^{2}}}}](https://wikimedia.org/api/rest_v1/media/math/render/svg/b0e2ca62c4f94a759b505826c9dac8240d3d2d72)
where , and is the local mean, given by


The coherency spectrum may be used as a thresholding field to identify noisy signals. Spectral lines with are classified as noise. Spectral leakage from range gates with a high spectral density can cause a bias in the estimated noise. This is eliminated by removing range gates with maximum power spectral density more than 40 dB above the system noise floor from consideration.

A noise-corrected coherency spectrum is now calculated by subtracting the noise floor from the power spectral densities and . The signal to noise ratio may be increased by removing spectral bins with .


The texture of and behave differently in ground clutter and precipitation, as shown in the figure below. This allows a ground clutter detection algorithm to eliminate spectral and range bins that contain ground clutter by thresholding based on the textures. The remaining range and spectral bins are due to precipitation echo, and are used to estimate the spectral moments.

Histograms of the textures of and and the histogram of ρhv . Separate histograms for ground clutter and precipitation are shown.

The extended time-series recording capability of the CSU-CHILL radar system is used to collect large volumes of oversampled data suitable for use by the spectral decomposition algorithm. The high coherence between the transmitted waveforms yields high in precipitation, which makes the clutter and noise classification algorithms more robust.
The figure below shows the horizontal reflectivity obtained from a stratiform winter storm event. The upper panel is unfiltered data. To the west of the radar, at a range of approximately 50 km, the reflectivity values are very high due to echoes from the Rocky Mountains. The 50 dB IIR filter does not completely suppress these echoes, while the spectral decomposition mask correctly identifies the ground clutter and suppresses it below the receiver noise floor.

|

|
| (a) Unfiltered | (b) Filtered using IIR filter |

|

|
| (c) Reflectivity, Filtered using DPSP filter | (d) Velocity, Filtered using DPSP filter |

PPI data processed with DPSP filtering
LDR Measurement in Simultaneous Transmission Mode
The Linear Depolarization Ratio gives the amount by which a linearly polarized signal is depolarized, after reflection from hydrometeors. It provides information about mixed precipitation types, such as ice particles coated with water after partial melting. It may also be used as a means to classify hydrometeors [5]. Traditionally, weather radars have measured LDR by alternating between H and V polarization modes, and measuring the cross polar return signal in each case. Modern dual-polarimetric weather radars, however, have moved towards the use of Simultaneous Transmission (STAR) mode, which offers several benefits over alternating mode [9]. This mode, however, does not allow direct measurement of cross polar return signal, since the copolar return signal from the opposite polarization dominates in signal strength.
Orthogonal channel coding [10] provides a method that allows spectral separation of the copolar and cross-polar return signals, which allows the linear depolarization ratio to be estimated in simultaneous transmit mode. The following sections present an implementation of this technique, using the capabilities of the CSU-CHILL radar to implement independent phase coding on the two polarization channels, and the results from the same.
The CSU-CHILL radar, due to the dual-channel digital transmitter, can generate an independently coded sequence of pulses in the horizontal and vertical polarization channels. Two codes and are used to modulate the H and V transmitted phase sequences, respectively. The signals received at each receiver channel are given by


where representes the signal when transmitting polarization and receiving polarization . The received signals may be decoded by multiplying by the complex conjugate of the codes and , giving


where and .


The effect of the code on the cross polar components ( and ) depends on the properties of the phase code used. Of the available phase codes, the Walsh code was found to have the best properties for this application. It has the effect of shifting the power spectrum of the cross-polar signal by rad/sec in the frequency domain. This is illustrated below:


Illustration of effect of orthogonal coding on the co-polar signal spectrum combined with cross-polar signal
Since we have a priori knowledge that the cross-polar signal will have lower signal power than the co-polar signal, we can identify the two peaks in the spectral domain and determine the center frequencies of the two power spectra. They may then be separated using notch filtering.
Several data sets were collected using the CSU-CHILL radar in order to verify the performance of the algorithm. For each case, the radar was operated in alternating transmit mode to collect the truth data. After this, a Walsh-coded waveform sequence was loaded into the digital transmitter controller and a second data set was collected in simultaneous transmit mode.
The first data set was collected on May 29, 2007 with the radar performing RHI scans through a stratiform rain event. Stratiform rain events are known to produce a distinct pattern known as the bright band due to the transition from ice particles to water-coated ice at the melting level. The measured radar variables are shown below:

|

|
| (a) Reflectivity | (b) LDR |
RHI scan through stratiform rain. Top panel shows the truth data from alternating mode, bottom panel is retrieved from Walsh-coded simultaneous transmit mode
Summary
The new capabilities offered by the CSU-CHILL digital transmitter controller, digital receiver and networked signal processor have been demonstrated using a variety of applications. The goal of the CHILL radar processor to power cutting-edge research in radar signal processing has been realized.
Further Reading
External Links
- ICS-554 Product Description at GE-Fanuc
References
- ↑ Mueller, E. and E. Silha, 1978: Unique features of the CHILL radar system. 18th Radar Meteorology Conf., Amer. Meteor. Soc., Atlanta, 381–382.
- ↑ Mueller, E., S. Rutledge, V. Bringi, D. Brunkow, P. Kennedy, K. Pattison, R. Bowie, and V. Chandrasekar, 1995: CSU-CHILL radar upgrades. 27th Conf. Radar Meteor., Amer. Meteor. Soc., Vail, CO, 703–706.
- ↑ Brunkow, D., V. Bringi, P. Kennedy, S. Rutledge, V. Chandrasekar, E. Mueller, and R. Bowie, 1999: A description of the CSU-CHILL National Radar Facility. J. Atmos. Oceanic Technol.
- ↑ Chandrasekar, V., Y. Cho, D. Brunkow, and A. P. Jayasumana, 2005: Virtual CSU-CHILL radar: The VCHILL. J. Atmos. Oceanic Technol., 22, 979–987.
- ↑ 5.0 5.1 Bringi, V. and V. Chandrasekar, 2001: Polarimetric Doppler Weather Radar: Principles and Applications. Cambridge University Press.
- ↑ Torres, S. and D. Zrnic, 2003: Whitening of signals in range to improve estimates of polarimetric variables. J. Atmos. Oceanic Technol., 20, 1776–1789.
- ↑ Choudhury, S. and V. Chandrasekar, 2007: Wideband reception and processing for dual-polarization radars with dual transmitters. J. Atmos. Oceanic Technol., 24, 95–101.
- ↑ Hefner, E., 2006: Range Oversampling and Whitening of Radar Signals from Volume Scattering. Master’s thesis, Colorado State University, Fort Collins, Colorado.
- ↑ Doviak, R., V. Bringi, A. Ryzhkov, and A. Zahrai, 2000: Polarimetric upgrades to operational WSR-88D radars'. J. Atmos. Oceanic Technol., 17, 257–278.
- ↑ Chandrasekar, V., N. Bharadwaj, and J. George, 2007: Waveform coding for dual polarization weather radars. Proc. IEEE IGARSS’07