Time lapse observations of outflow phenomena: 11 August 2011

Inbound (negative) radial velocities in excess of 25 mps were observed at low elevation angles near low-reflectivity showers on 11 August 2011. (The arrow in the image points towards the radar.) Time lapse images of various outflow phenomena that occurred under dry boundary layer conditions have been assembled.
Introduction
The sounding data collected at Denver, CO during the late afternoon hours on 11 August 2011 contained an "inverted V" thermal structure with a dry, well-mixed layer between the surface and the ~500 mb level.

Above the dry surface layer, winds were generally from the west as speeds of 40 - 60 knots. Clouds present at these heights would thus have appreciable translation speeds. Any associated precipitation that descends into the dry surface layer would be subjected to evaporation; the resultant cooling and associated negative buoyancy promotes downward air motions (Wakimoto, 1985 MWR 1131-1143). The combination of relatively fast echo motion and evaporatively-assisted downdrafts acted to enhance outflow velocities in the CHILL area on 11 August.
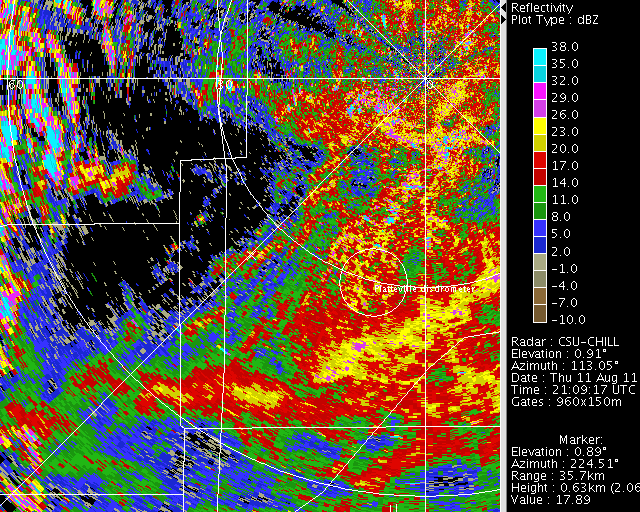
Reflectivity loop
The frames in the following image loop were taken from a series of 0.9 degree elevation angle PPI sweeps made at time steps of 1 minute and 55 seconds. The shower echoes of interest are just exiting the foothills approximately 50 km west-southwest of the radar at the start of the loop. As they move rapidly towards the east southeast, their associated outflow generates a fine line pattern that is reminiscent of the bow wave produced by a moving ship. At least two other echo evolution patterns are also evident:
- Near frame #13, a separate precipitation echo develops ~20 km south of the radar.
- Two approximately east-west oriented boundaries collide near the southern border of the image area.
The accurate numerical prediction of such locally-varying mesoscale features is clearly challenging.
|
|
||
|
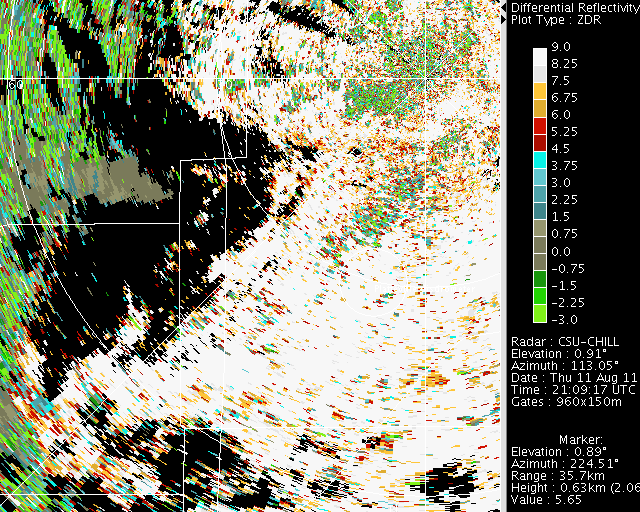
Differential reflectivity loop
The following loop shows the corresponding differential reflectivity (Zdr) field. The highly oblate shapes of the insects flying in the boundary layer generate large positive (7 - 9 dB) Zdr levels. The Zdr's in the rain areas associated with the modest shower echoes seldom exceed 3 dB.
|
|
||
|
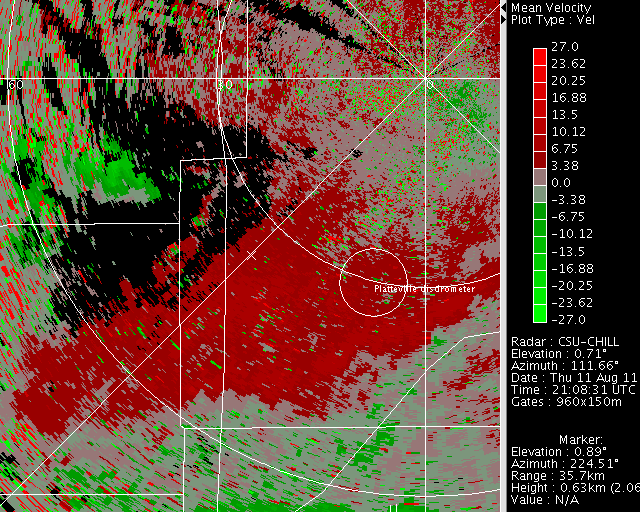
Radial velocity loop
Radial velocity data observed at the 0.5 degree elevation angle is shown using the NWS color scale in the following loop. Inbound velocities peak in the -20 to -25 mps range as the showers move from Larmier into Weld County. These strong winds never reached the CSU-CHILL radar site. In the later stages of the loop, outflow associated with the new cell located south of the radar intensifies. Since the scatterer motion is away from the radar at this location, the radial velocities are positive in sign.
|
|
||
|
Digital image loop
While the radar data shown above was being recorded, a digital camera at the CSU-CHILL radar site was looking slightly west of south and recording images at 1 minute time intervals. (The first image was taken at 2126:12 UTC and the last at 2215:12 UTC). An area of blowing dust and light rain associated with the "bow wave" shower enters the field of view at ~2150 UTC (Frame #25). The localized strong winds that often develop near rain showers in the inverted-V sounding environment can significantly impact airport operations.
|
|
||
|

References
- Wakimoto, Roger M., 1985: Forecasting Dry Microburst Activity over the High Plains. Mon. Wea. Rev., 113, 1131–1143.