Selected dual-Doppler observations of a snow band: 15 March 2013
Author: P. C. Kennedy
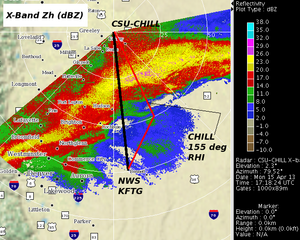
CSU-CHILL X-Band (9 GHz) reflectivity data observed in an extensive snow band on 15 April 2013. Beam intersection angles between the CSU-CHILL and NWS KFTG radars were large enough to permit dual-Doppler wind syntheses to be done in the vicinity of the intersecting red lines. Selected dual-Doppler and CSU-CHILL X-Band RHI plots of the snow band data have been assembled.
Introduction
A snow band crossed the CSU-CHILL radar site while moving slowly towards the southeast during the morning hours of 15 April 2013; the radar was operating in single frequency (X-Band) mode for the FROST 20 hr project. By ~1700 UTC, the band axis lay across the dual Doppler lobes defined by the regions where the beams of the CSU-CHILL and NWS KFTG radars intersected at angles of 30 degrees or more. A PPI sector scan was manually started at 1715:45 UTC in an effort to fall into synchronization with the KFTG radar. (The corresponding KFTG volume scan started at 1715:50 UTC). Following this synchronized scanning period, RHI scans across the band axis were done ~12 minutes later at 1727 UTC.
Dual Doppler analyses
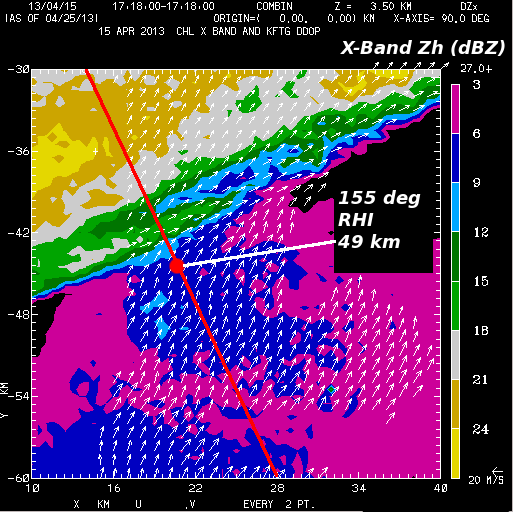
The input data from the two radars was interpolated to a common 0.5 km XYZ mesh array of Cartesian gridpoints with the origin at CSU-CHILL. The horizontal wind field was synthesized from the gridded radial velocity data using the NCAR CEDRIC software. The following plot shows the Earth relative flow at the 3.5 km MSL height level. For reference, the location of the 155 deg azimuth done at 1727 UTC has been added. The solid dot marks the 49 km range point along the RHI plane. At the 3.5 km MSL level, the 49 km range dot is located ahead of the snow band in a region of converging flow:
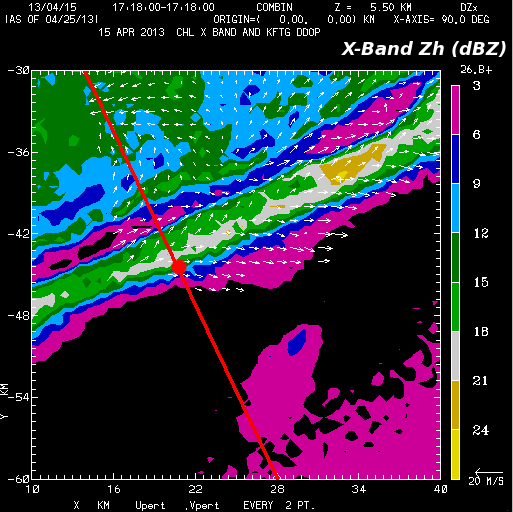
The next plot shows the analysis results 2 km higher up at the 5.5 km MSL CAPPI level. The higher reflectivities associated with the snow band reached the 49 km range dot at this height, implying the presence of an "overhanging" structure. A narrow region of low reflectivities was located immediately northwest of the highest reflectivity portion of the band. A lower intensity secondary echo band was found ~8 km northwest of main reflectivity axis. To make the more subtle features of the flow field evident, the mean U and V values of the horizontal wind at the analysis height have been subtracted. The residual "perturbation flow" vectors imply the existence of an axis of divergence near the snow band axis and convergence along the intervening weak echo line:
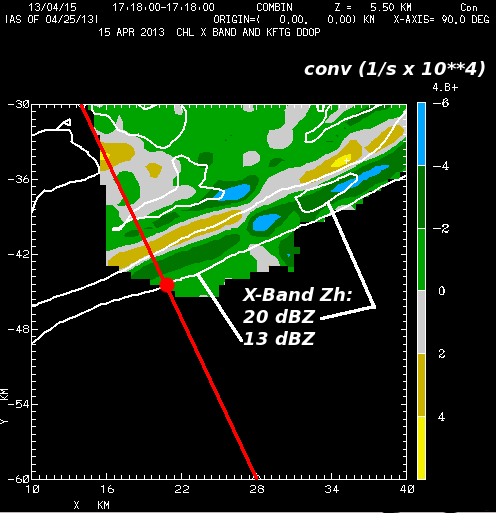
The convergence field at the 5.5 KM height level is shown as a color fill in the following plot. The locations of the two linear echo features are shown by the solid white 13 and 20 dBZ contour lines. Divergence (negative convergence) is generally found along the higher reflectivity axes. Since convergence was found at the 3.5 km MSL analysis height shown previously, upward vertical motion is implied between the 3.5 and 5.5 km heights along the axes of higher reflectivity. (Preliminary calculations of vertical air velocities based on downward integrations show 2 - 3 mps updrafts along the echo band axes).
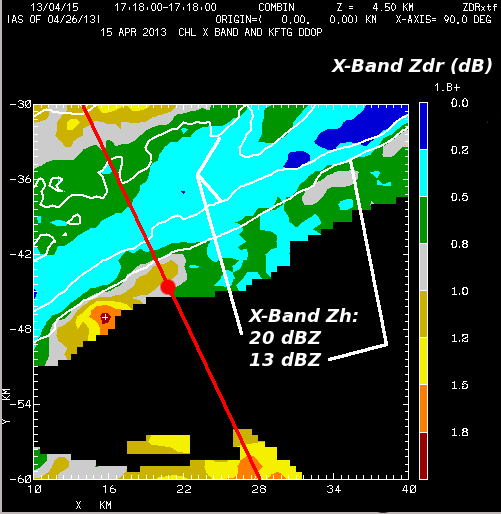
The following plot shows the X-band differential reflectivity (Zdr) at 4.5 km MSL (i.e., between the previously-presented 3.5 and 5.5 km heights). The stronger reflectivities along the snow band are associated with near 0 dB Zdr. Zdr's become more positive in the lower reflectivity areas both ahead of and behind the main band axis. This probably is due to the presence of more pristine, horizontally-oriented ice crystals in the outer band areas vs. the unaligned, quasi-spherical aggregated snow particles in the stronger reflectivity regions.
RHI data
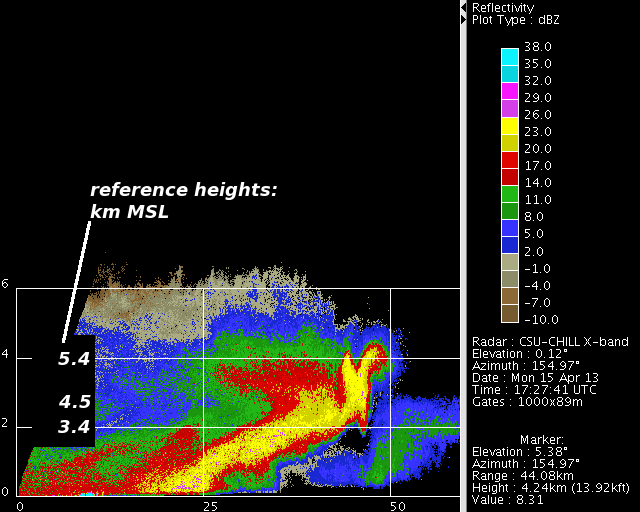
The following series of plots were taken from the RHI volume that was done ~10 - 12 minutes after the dual-Doppler analyses. The RHI reflectivity pattern suggests that an elevated snow generating cell with an overhanging structure was located near the 49 km range point. The two vertical protrusions in the generating cell structure are consistent with the two echo band features seen in the 5.5 km MSL dual-Doppler plots.
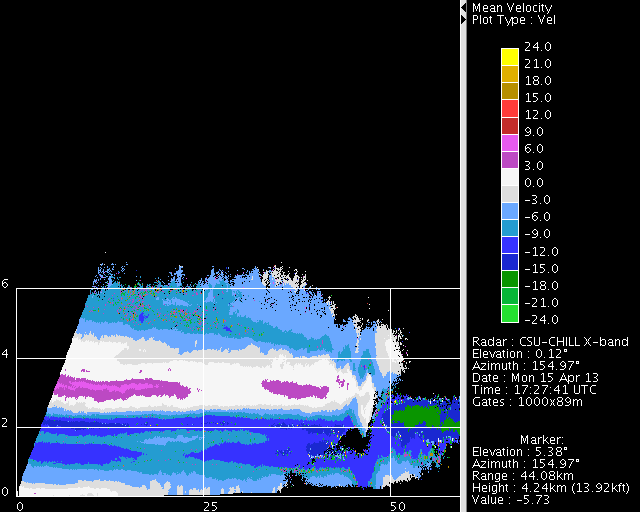
The radial velocity pattern is in agreement with the dual Doppler identifications of convergent and divergent regimes at the 3.5 and 5.5 km MSL levels respectively.
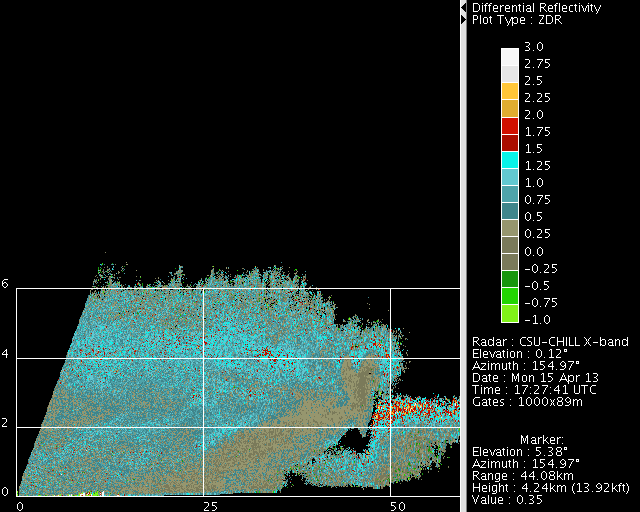
The Zdr field shows that the near 0 dB values associated with the higher reflectivity portion of the generating cell continue to the surface along the precipitation streamer. More positive Zdr values were found in the surrounding "quiet crystal" areas.
Summary
The data collected by the high resolution (0.3 deg half power beam width) CSU-CHILL X-Band system is well suited to the examination of the fine scale echo features present in a snow band.