Real-time Display
The CHILL Real-time Display is a radar visualization tool for Linux, which allows the radar variables generated by the signal processor to be viewed in real-time in a variety of ways. The display communicates via the VCHILL protocol to the signal processor. The processor sends beam-by-beam data to the display. Scan conversion of the incoming data from polar (r-θ) to Cartesian coordinates is done using an algorithm that is guaranteed to not generate "holes" in the display, while not producing overdraw. Users can interactively zoom and pan the display while maintaining high update rates. External GIS mapping tools are used to generate a base map and an overlay. Display read-outs provide numeric information. Annotations provide at-a-glance information about the radar operating state.
Concepts
The real-time display program makes use of a hole-free scan conversion algorithm to map polar data to Cartesian coordinates. In addition, it can also interpolate the data using a bilinear interpolation algorithm. Rather than the traditional thresholding operation performed by radar display programs, the CHILL real-time display uses the thresholding parameter to control the transparency of the rendered data, improving the overall quality. Multiple radar products (referred to as "fields") can be displayed, each in its own display window, as either a PPI/RHI or as an A-scope (parameter vs. range).
The scan-converted radar data is held in memory as a bitmap, which is then composited with several other bitmaps:
- Background color
- Base map
- Radar data
- Axes (range rings and radials)
- Map overlay
- Vehicle tracks
- "Heads-up Display"
- Markers
The base and overlay maps are retrieved from a specified Web Map Service (WMS) server, which can provide map data for the dimensions of the window and the geographic extents presented. Aircraft tracks are available from the signal processor during data collection projects that involve aircraft or mobile vehicles.
The "heads-up display" is a mini-annotation box that is rendered next to the mouse cursor. This permits users to make data readouts without moving their visual focus away from the mouse pointer that is selecting the data for readout.
Markers permit the user to obtain data readouts from a fixed location over multiple scans.
Each plane can have its overall transparency adjusted, to display data that lies beneath.
Main Window
The main control window of the display program is subdivided into tabs.
Available Fields

This tab lists all available fields from the moment server, along with their minimum and maximum values. PPI/RHI displays or A-scope windows can be launched from here by clicking on the appropriate checkbox. In the figure, the Reflectivity PPI/RHI display has been opened by clicking the checkbox. The user may adjust lower and upper limits of the displayed data using the Min/Max columns - click the number to show an editor where the new limts may be entered.
The Field, Units and Description columns are purely informational and cannot be updated.
Transmitters
This tab shows a time history of transmitter power, and a summary of the transmitter operating state. It is intended as a quick monitor of transmitter status.
Layers
This tab permits the transparency of individual layers presented in the display program to be modified. The default background color of the windows (where the base map data is transparent) may also be changed.
Tracks
Lists information about aircraft tracks, if available from the signal processor. One track may be highlighted for closer examination, and track histories may be cleared.
Display Windows
PPI Window

The Plan Position Indicator (PPI) display shows a range vs. azimuth display. Color values indicate the variable value at each point. The display on screen is the composited result from multiple bitmap layers, including the base map, radar data, overlay and heads-up display. Each of these features may be disabled or partially made transparent.
On the right side is an annotation pane. Color scale information pertaining to the PPI window is shown here, along with units. Also included is at-a-glance information such as polarization mode, transmitter power, date and time of the radar.
Along the bottom, the marker and cursor position and values are shown. The marker is positioned by clicking on the map. The cursor represents the value under the current mouse position. Also shown are the antenna position and the current scan name which the radar is executing.
Users can zoom the display by selecting the Zoom In tool button and dragging a rectangle representing the region to be zoomed. The display will choose the correct scale factor and center point to show the chosen area. The display center can also be set using the mouse. This allows the user to peruse the current scan as it arrives from the radar. Due to internal caching of data from the signal processor, one does not have to wait for new data to arrive after changing the zoom or display center.
Finally, the display shows a histogram of the values within the current display window. This may be used to get quick estimates of bias. Note that since the real-time display shows data that has been quantized to 8-bit values for bandwidth reduction, the histograms are only rough estimates.

RHI Window

The Range-Height Indicator (RHI) display shows the radar data in a range vs. height display. It is used when the radar executes vertical scans. Similar to the PPI mode, pixel color indicates the variable value at that point. No base map is shown in this case, however, range rings and radials are shown as an overlay over the data.
Most features of the PPI display, such as zooming and panning are maintained in the RHI display. In addition, the height axis may be scaled differently from the range axis by using the RHI stretch factor; this allows the vertical structure of storms to be more carefully examined. The height displayed is corrected for a curved earth model, and also takes into account the standard atmospheric model for height correction with range. If desired, this behavior may be turned off.
A-scope Window

The A-scope shows a range profile of the selected variable from the signal processor. It is useful for measuring range trends. The a-scope has two operating modes, a realtime mode and a fixed mode. In realtime mode, the a-scope updates itself each time a new ray arrives from the signal processor. This gives a continuously updating waveform on screen, which is useful for diagnosis and when the antenna is in fixed-pointing mode.
In the fixed mode, the display shows the range profile at the marker position on a corresponding PPI or RHI view. This allows range profiles at various locations to be examined in detail.
The A-scope allows the user to zoom and pan the display using the mouse. Zooming is done by drawing a bandbox of the region to zoom. Once zoomed, the display scrollbars become active and allow the display to be panned in either axis.
A cursor and marker are available in the a-scope. The marker is synchronized with the marker in the PPI/RHI displays, and is shown on the a-scope as a dashed line. The cursor position is shown as a triangle with the corresponding range and value underneath. The value at the marker and cursor is shown on the status bar on the bottom of the a-scope.
Post processing options are available to the user in the form of smoothing. Three types of smoothing are available, as shown in the table below.
| Method | Features |
|---|---|
| None | No smoothing applied |
| 3x Averaging | Average of current gate with adjacent gates |
| 5x Averaging | Average of gate with two adjacent gates |
| 5x FIR | A simple FIR filter is applied to the two gates surrounding each gate. |
Display Properties
Various options related to display of radar data in the PPI, RHI and A-scope modes may be accessed under the Display Properties dialog box, found under the Main window "Edit" menu. There are a large number of options, which are grouped into several tabs.
Data tab
Display Mode allows the user to choose the behavior of the PP/RHI windows. The available choices are:
| Mode | Description |
|---|---|
| PPI | Radar data is always interpreted as if antenna is in PPI mode |
| RHI | Radar data is always interpreted as if antenna is in RHI mode |
| Auto | Display switches between PPI and RHI modes, depending on the current antenna mode |
Zoom Out factor is the percentage change in the zoom level when the user clicks the "Zoom Out" tool button in the PPI/RHI windows
Update Display Every x Rays permits a tradeoff between display update rate and CPU usage. Low values update quickly, but use up more CPU time. High values exhibit slow update rates, but is more suitable for slower machines.
The RHI Stretch factor is the amount by which the height axis is scaled in RHI mode. Higher values present a distorted view, but emphasize the vertical structure of the received echoes.
Data and Overlay transparencies adjust the relative transparencies of these layers in the PPI/RHI windows. These are synonyms to those found in the "Layers" tab of the main window.
The Earth Model permits the user to choose the model used to simulate the curved path of the radar beam. Both models make use of the 4/3R correction, while the Curved model also includes refraction effects on the beam.
The Smoothing option allows the user to choose the algorithm used to smooth the radar data. The smoothing is done before scan conversion from polar to Cartesian coordinates.
| Method | Description | Properties |
|---|---|---|
| None | No smoothing applied | Most accurate display of radar data |
| 1D Mean | Pixel is average of adjacent range gates | Some smoothing in the radial direction. |
| 2D Mean | Pixel is average of adjacent range gates and azimuths | Provides smoothing in both radial and azimuth directions |
| 1D Median | Pixel is the median of adjacent range gates | Removes outlier points in the radial direction. |
| 2D Median | Pixel is the median of adjacent range gates and azimuths | Removes outlier points using data from both radial and azimuthal directions. |
The mean filters perform simple smoothing, they tend to reduce the variance of the fields due to averaging. They do not attenuate speckle noise seen due to interference, birds, aircraft, etc. Median filters are good at removing speckle noise, but do not reduce the variance as much as the mean filters.
Note that the smoothing mode only affects data display. Numerical readouts use the unsmoothed data.
Interpolation allows the user to select the interpolation algorithm used during the scan conversion step.
| Method | Description | Properties |
|---|---|---|
| Nearest Neighbor | Picks the closest polar coordinate point corresponding to each pixel | Most accurate display of radar data |
| Bilinear Interpolation | Picks the four closest polar coordinate point corresponding to each pixel and interpolates the color value based on distance to each point. | Smooth display of data, especially when zoomed in very closely. |
Note that the interpolation mode only affects data display. Numerical readouts use the non-interpolated data.
Auto-clear clears the display every time the fixed angle (Elevation in PPI mode, Azimuth in RHI mode) changes by more than the specified value, in degrees.
Gracefully age-off old data, if enabled, causes older data to gradually fade away from the screen, rather than disappearing when it eventually gets evicted from the cache.
Enable Thresholding enables the alpha-blended thresholding algorithm described below, making use of the Field selected in from the list.

Edit Alpha Curve opens the transparency alpha curve editor. The display program makes use of alpha-blending to implement thresholding. This means that the thresholding need not be an on-off action. Gradual slopes of any arbitrary shape can be programmed in through the alpha editor. Conventional thresholding can be emulated by drawing thresholding function in the alpha editor. This method of thresholding improves the visual quality of the result, since thresholded edges appear smoother than with conventional thresholding schemes.
Displayed Range shows the maximum range of radar data to be displayed in the PPI/RHI/Ascope modes. If the Auto checkbox is selected, this value is automatically updated from the signal processor.
Range Doubling repeats the displayed data at 2x range. Note that no attempt is made to modify the correction implemented by the signal processor.

Histogram Bins allows the user to change the number of bins shown in the histogram part of the PPI/RHI display.
Maps tab
The Download Basemaps and Overlays checkbox must be checked to allow the display to contact remote WMS servers to obtain base maps and overlays. Downloading remote maps may be disabled when using the display in low-bandwidth conditions or where no WMS server is available.
Map/overlay Refresh Delay allows the user to tweak the delay between the time the PPI display window needs updating to when the map server is contacted for a new base map or overlay. Smaller values make the display more responsive, but tax the server resources. Typical usage patterns of the display window involve users making small adjustments to the zoom/pan settings, which would otherwise result in a large number of repeated requests for new maps to the server.
Marker tab
Units allows the user to choose the units and coordinate system in which distances and are displayed.
Marker Style, Marker Size and Marker Thickness and Marker Color select the type of marker shown.
Heads-up Display Transparency controls the transparency of the HUD display. The Mode chooses the information displayed within the HUD. The offsets are offsets away from the current mouse position where the HUD is displayed.
Axes tab
Range Rings controls the spacing between range rings (in km), Radial Spacing controls the spacing between radials in degrees. The Transparency controls how bright the axes are shown over the data. The Color, Line Style, Line Thickness and Font control the appearance of the range rings. If Show Axis Text is selected, radials and range rings are labelled with text markers in the specified font.
If Sector Limit Marker is checked, the display will show the sector limits in PPI mode when the antenna is executing a sector, or the lower and upper limits of the RHI when in RHI mode. The Line Style and Thickness apply to the sector limit markers if they are shown.
A-scope tab
The Background Color, Trace Color, Trace Thickness and Trace Border control the appearance of the trace in the A-scope window. The Invalid Data Action describes the behavior of the trace when data is not available from the processor.
The Marker Color and Cursor Color affect the behavior of the markers and cursors in the a-scope window. If Show value is checked, the numeric data is shown at the cursor location.
Map Layer Selectors
The base and overlay map layer selection dialog boxes may be accessed from the main window Edit menu. These dialog boxes permit users to select the WMS Server URL. The Retrieve button refreshes the list of layers. The list shows a description of each layer with a check box controlling layer visibility. Layers are enabled by clicking the check boxes. Auto-refresh causes a new map to update at the specified time interval.
These dialog boxes are non-modal, meaning they can be left open while interacting with other parts of the real-time display.
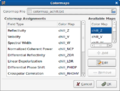
Color Map Selector
The color map selector allows users to select a remote map (with the Pick button) or a local map (Load button). Once loaded, the dialog box permits different color maps to be associated with the fields available from the signal processor in the Colormap Assignments list. Available color maps are shown in the Available Maps list. Individual maps may be edited using the Edit button, which brings up the color table editor.
Selecting the Use field limits defined in color map file will cause the display to assume the field limits specified in the color map file. This is useful for certain color maps that require a specific field limit to work well.
Remote color maps are selected using the Pick button, which brings up the Map File Picker dialog box. The Server Name field indicates the server where color map files reside. The table shows the file name and descriptions for each map. Select a map and click OK to load that color map.
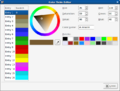
Color Table Editor
The Color Table Editor shows the selected color table in a list to the left. Entries can be edited, added or removed. In addition, one can create gradients between any two entries already present. Gradients can be produced in RGB or HSV color models, and individual parts of the model can be enabled or disabled during gradient creation.
Several color maps are available, these can be selected using the Color Map Editor. Each Color Map has several color tables which can be associated with a particular field. The field assignments are done in the Color Map Editor, while the color tables themselves are edited in the Color Table Editor.
-
Real-time Display Color Map Editor
-
Real-time Display Color Table Editor


Downloading
Required Libraries
This section lists the libraries required to build the display program. Note that the steps given work only for distributions such as Fedora Core that use the Yellowdog Update Manager (YUM). Please refer to your Linux distribution's documentation for similar instructions for other distributions.
| Package | RPM name | Minimum version | Description |
|---|---|---|---|
| GTK 2.0 | gtk2-devel | 2.14 | Windowing toolkit |
| GNet 2.0 | gnet2-devel | 2.0.8 | Networking layer for glib |
| Libglade 2.0 | libglade2-devel | 2.6 | Helper library for widget/window creation |
| LibCURL | curl-devel | 6.0 | File transfer library |
| GTKDataBox | gtkdatabox-devel | 0.9 | Graph visualization package |
| LibXML | libxml | 2.0 | XML Parser |
You can install these packages with the following commands as root:
# yum -y install gtk2-devel gnet2-devel libglade2-devel
# yum -y install curl-devel gtkdatabox-devel libxml-2.0
Required Tools
This is a list of tools required to build the software. Again, the install steps work only for YUM based distributions
gcc (C compiler), automake, libtoolize and autoconf (build tools)
# yum -y install gcc automake autoconf libtoolize
git (version control system - required if using the git installation method, see below)
# yum -y install git
Installation
The real-time display is a part of the CDP signal processing suite, which is available on request as a tarball or via git.
Using a tarball
Extract the tarball to a working directory.
$ tar zxf cdp.tar.gz
Change directories to the display program and execute the build steps.
$ cd cdp/gtk_display
$ ./autogen.sh
$ make
Installing the program (must be root for default install target, which is /usr/local)
# make install
Using git
Clone the cdp git repository to a working directory on your machine, by following the instructions here. The remaining steps should be the same as above.
Running the program
You can run the program from the working directory
$ cd cdp/gtk_display/src
$ ./gtk_display
Once the installation step described above is completed, you can run it from anywhere:
$ gtk_display
If installed as root, entries will be created under your window manager menus (if available). On Fedora and derived distributions, this is under Applications->Other->GTK Display.