Polarimetric radar identification of frozen hydrometeors in thunderstorm precipitation: 6 August 2010
CSU-CHILL radar data indicating that both hail (positive Hail Differential Reflectivity; HDR) and heavy rain (large specific differential propagation phase; Kdp) are present in a low elevation PPI sweep through a thunderstorm. A series of plots documenting the time evolution of this hail / rain mixture have been prepared.

Introduction
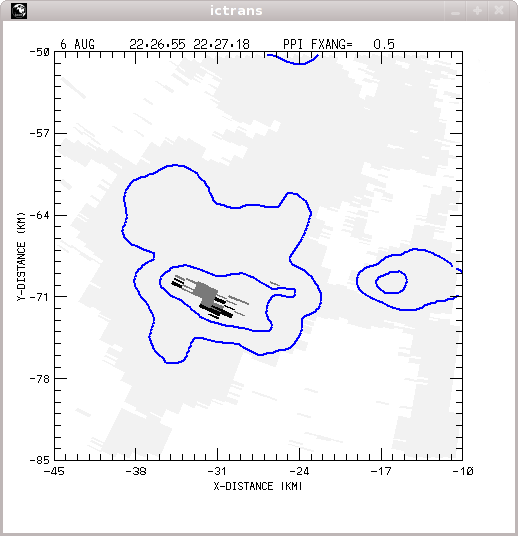
An isolated thunderstorm that passed over the northern portions of Denver was observed during the afternoon hours of 6 August 2010. The CSU-CHILL data that was collected in a series of low elevation angle PPI scans was processed using the methods of Cifelli et al (JTEC 2010) to estimate specific differential propagation phase (Kdp) and to identify range gates where hail was a significant precipitation component. The grey shades in the following plot show an example of the three hydrometeor categories that were identified in a 0.5 deg PPI scan at 2234 UTC:

Hydrometeor classification loop
The following loop shows the evolution of these hydrometeor classifications during the 2226 - 2246 UTC time period. The diagnosed level of ice contamination becomes insignificant by the end of the loop.
|
|
||
|
CSU-CHILL 2234:11 UTC 0.5 deg elevation PPI plots
Since hailstones generally have larger backscattering cross sections than raindrops, the presence of hail complicates the estimation of rain rates from the co-polar reflectivity level. The CHILL radar observed reflectivity levels reaching the 50 - 60 dBZ range at 2234 UTC. As shown in the preceding loop, hail contamination was also detected at this time:

Using the CSU HIDRO methods of Cifelli et al (JTEC 2010), reflectivity-based rain rate formulations are not used at locations where ice contamination has been diagnosed; Kdp-based rate estimates are used in these areas. The CSU-HIDRO rain rate field is shown in the next plot. Rain rates peak at values of ~120 mm / hr:

KFTG 2233:01 UTC 0.5 deg elevation PPI plots
The next two plots were generated from data collected by the NWS KFTG WSR-88D radar at 2233:01 UTC (approximately one minute earlier than the CHILL scan shown above). Due to the shorter range (~30 km vs. ~80 km), the NWS 0.5 deg PPI data was collected closer to the ground with smaller pulse volume widths in the azimuthal direction. Nevertheless, similar echo patterns are evident:

Current (i.e., before the polarimetric upgrade) NWS rain rate estimations are based only on co-polar reflectivity. To reduce over estimates due to hail, a reflectivity limit of 53 dBZ is applied before the "Z(R)" rain rate calculation is done. This translates into a maximum rate of 103 mm / hr. The effect of this artificial limit can be seen in the following plot. The Kdp-based rate estimations provided by dual-polarization data improve the remote sensing of rain rates in the presence of hail contamination.

References
- R. Cifelli, V. Chandrasekar, S. Lim, P. C. Kennedy, Y. Wang, S. A. Rutledge: A New Dual-Polarization Radar Rainfall Algorithm: Application in Colorado Precipitation Events Journal of Atmospheric and Oceanic Technology, 28, pp. 352-364
- K. Aydin, T. A. Seliga, and V. Balaji:Remote Sensing of Hail with a Dual Linear Polarization radar Journal of Applied Meteorology and Climatology, 25, pp. 1475-1484