Outflow development beneath a thunderstorm complex: 8 July 2008

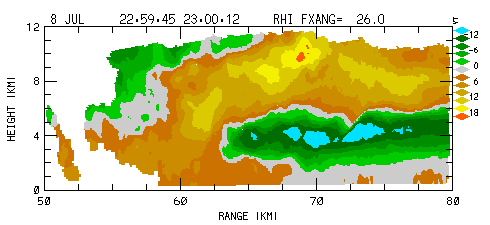
RHI sweep containing a descending rear inflow jet pattern (white arrow) in the radial velocity field. The time evolution of this pattern was observed in a series of RHI scans made at approximately 2 minute intervals by the CSU-CHILL radar.
Introduction
The impingement of unsaturated environmental air tends to erode cloud and precipitation areas through evaporation and sublimation. The local cooling associated with these phase changes promotes negative buoyancy forces that can aid in the development of downdrafts and surface outflows in convective echoes. During the late afternoon hours of 8 July 2008, a series of RHI scans conducted by the CSU-CHILL radar captured the development of a surface outflow pattern that was related to an enhanced mid-level inflow on the rear side of a thunderstorm complex.
RHI Data
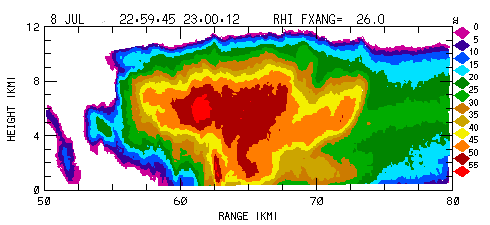
An RHI volume scan consisting of sweeps at four fixed azimuth angles was established to cover a thunderstorm complex that was located approximately 60 km northeast of the radar. In this scan pattern, individual RHI sweeps were repeated at an ~2 minute time interval. The following image loop shows the time evolution of the reflectivity field observed on the 026° azimuth RHI sweep. The height the most intense reflectivity values generally decreases over the loop’s 14 minute duration. Some of the pattern evolution is also due the echo motion component across the RHI plane.
|
|
||
|
The following loop shows the radial velocity field patterns observed in the 026° RHI sweep. A prominent feature is the inbound (negative) radial velocity region that was initially maximized near the 4 km AGL height level. This rear inflow jet signature has been associated with the impact of relatively dry, mid-level environmental airflow upon convective echo systems (Smull and House, MWR 1987 p2869-2889). During the final frames of the loop, these negative radial velocities descend to the surface and generate a convergent pattern at a range of ~55 km.
|
|
||
|
PPI Data
The following ~0.6° PPI scans were taken immediately before and after the time period covered by the RHI loops shown above. The reflectivity data is shown by color-filled contours. The overlaid solid contours are one-way specific propagation differential phase values () in deg / km. Positive regions develop when significant concentrations of oblate raindrops exist along the radar beam path and cause a phase retardation of the horizontally-polarized return signal relative to that of the vertically-polarized return signal. At S-Band, magnitudes of 1.5 deg / km are associated with rain rates of ~70 mm / hr. Over the course of the RHI scan period, a bowed-out reflectivity pattern and intense rain rates developed in the vicinity of the RHI plane. This evolution is similar to that reported by Atkins et al. (MWR Sept 2004, p 2224-2242).


References
- Smull, B.F., and R.A. Houze, 1987: Rear Inflow in Squall Lines with Trailing Stratiform Precipitation. Mon. Wea. Rev., 115, 2869–2889.
- Atkins, N.T., J.M. Arnott, R.W. Przybylinski, R.A. Wolf, and B.D. Ketcham, 2004: Vortex Structure and Evolution within Bow Echoes. Part I: Single-Doppler and Damage Analysis of the 29 June 1998 Derecho. Mon. Wea. Rev., 132, 2224–2242.