Macroburst radial velocity pattern on 23 July 2009
Introduction
When thunderstorm downdrafts interact with the ground, divergent, outflowing horizontal wind fields are induced. This divergent airflow produces a characteristic pattern in the radial velocity field observed by a Doppler weather radar.
Radial velocity data
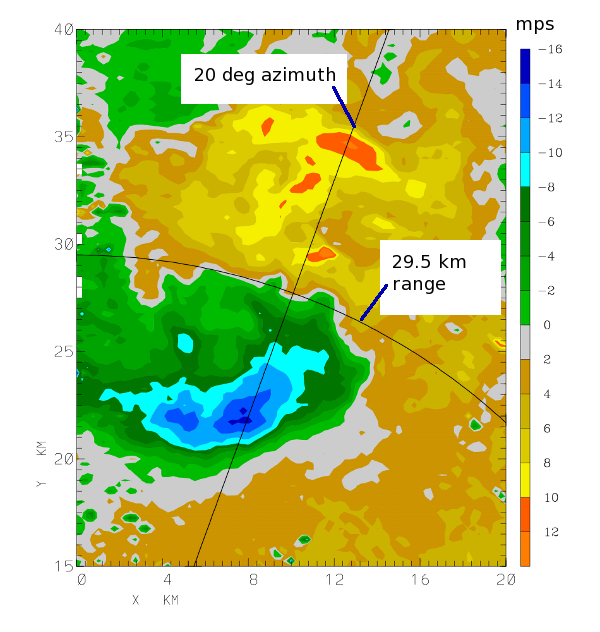
During the afternoon hours of 23 July 2009, isolated thunderstorms developed in the vicinity of the CSU-CHILL radar site. Surface conditions were relatively warm and dry. (The KGXY METAR observation at 2115 UTC had an air temperature of 33 C and a dew point temperature of 4 C.) This dry environment promotes the evaporation of hydrometeors; the resultant local cooling helps accelerate downward air motions in precipitation areas below thunderstorm cloud bases. The following plot shows the radial velocities observed in a 1 degree elevation PPI scan that was made through a thunderstorm precipitation shaft at 2206 UTC. Positive (outbound from the radar / orange) radial velocities were detected at more distant ranges while negative (inbound / blue) velocities were seen at the closer range edge of the storm. These local radial velocity maxima both existed along the 20 degree azimuth from the radar. Also, the zero mps radial velocity contour was essentially perpendicular to the 20 degree azimuth line. (i.e., the white zero mps line falls along the 29.5 km range ring.) This radial velocity pattern implies the existence of a divergent horizontal flow field near the surface beneath the thunderstorm.
Reflectivity data
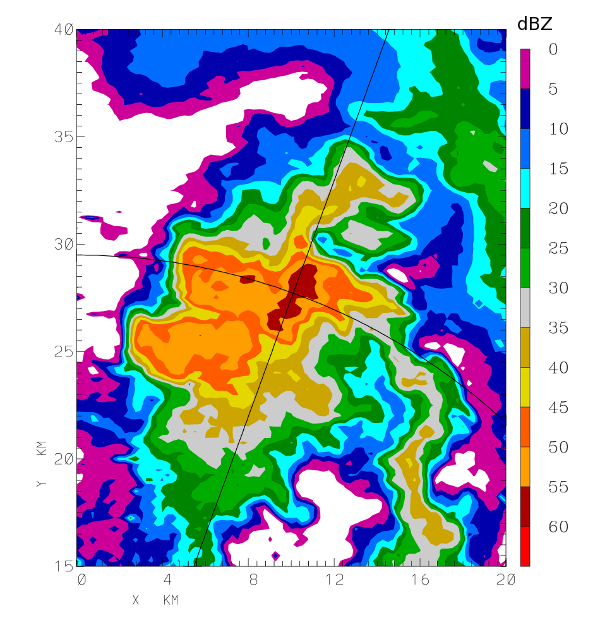
The corresponding reflectivity plot shows that the center of the divergent area was associated with a small, intense echo core.
Rain rate estimated from dual-polarization data
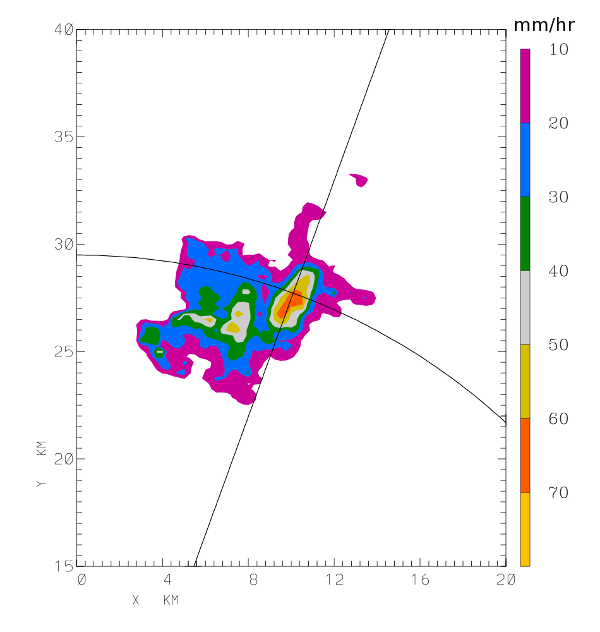
The CSU-CHILL radar also made observations of the differential reflectivity () and differential propagation phase shift () in this PPI sweep. In combination with the basic co-polar reflectivity information, these polarimetric data fields were used to estimate the instantaneous rain rate. As shown in the following plot, maximum rain rates on the order of 60 mm / hour were diagnosed in the echo core.
Photograph of the precipitation shaft
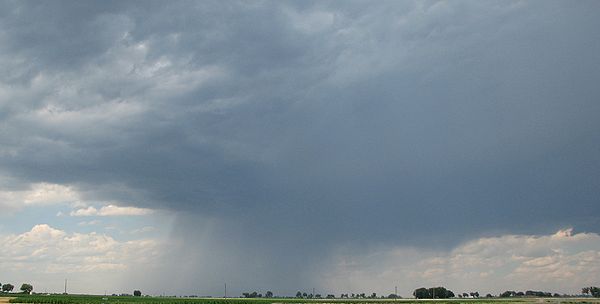
The following photograph of the precipitation shaft was taken from the CSU-CHILL radar site at 2106 UTC. The precipitation shaft was opaque at this time. These localized, variable wind and visibility conditions are typical in thunderstorm precipitation areas.


