Initial plots from flooding rainfall in Aurora, Colorado: 13 September 2013
Author: P. C. Kennedy

Rain showers passing the Aurora Colorado area during a widespread flash flooding event on 12 September 2013. Preliminary dual polarization plots have been assembled for the 1722 - 1822 UTC time period.
Overview
Between the evening hours of Wednesday, 11 September 2013 and mid-day on Friday, 13 September 2013 significant flash flooding occurred on many drainages from the Denver area northward through Larimer County. CSU-CHILL radar observations of this event started around 1530 UTC / 0930 MDT on Thursday, the 12th. The full radar data set is quite large. This article only considers a one hour time period (1722 - 1822 UTC on 12 September) when moderate reflectivity, relatively low Zdr "tropical" rain showers were contributing to flooding near Aurora, Colorado.
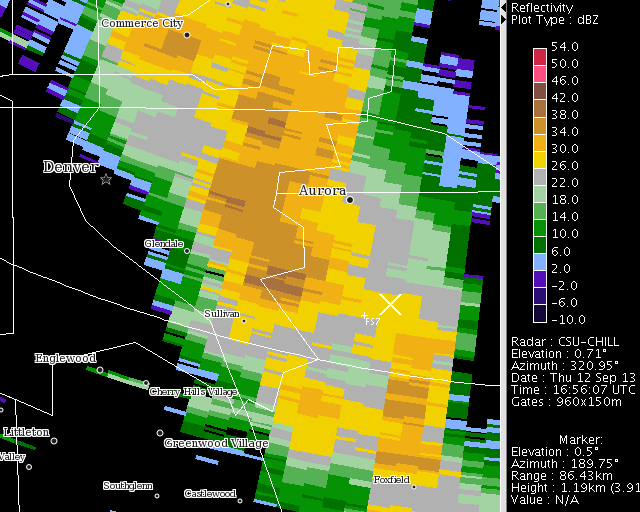
Reflectivity loop
The following loop was assembled from 0.5 degree elevation angle PPI scans that were conducted at slightly over 3 minute time intervals. Higher intensity echoes repeatedly moved across the eastern Denver / Aurora areas.
|
|
||
|
Differential reflectivity
The following VCHILL image shows the S-band differential reflectivity at 1722 UTC. The low (generally less than 1.5 dB) maximum values shown in this sweep were typical of the levels observed throughout the day. These low magnitudes indicate that the median diameter of the rain drop size distribution was small (~2 mm diameter or less).


XYE grid data plots
To generate contour plots, the data in the 1722 UTC 0.5 deg elevation angle PPI sweep were interpolated to a 500 m X, Y grid point array using the NCAR SPRINT program. The following plot shows the S-band reflectivity field. The point marked "FS" is the location of the Denver Urban Drainage and Flood Control District ALERT network tipping bucket rain gauge at Aurora Fire Station #7.

The following plot shows the corresponding S-Band specific propagation differential phase (Kdp) field. Maximum values in the vicinity of Fire Station #7 were approximately 0.6 deg / km.

The field observed at X-band (9 GHz) in the same PPI sweep is shown below. Due to the greater differential phase shift response at the shorter wavelength, magnitudes of ~2 deg / km were observed near the Fire Station. (The X-band should be larger than the S-band in proportion to the 9 / 3 GHz frequency ratio.) The cause of the spatial displacement between the S and X-band maxima has not yet been determined.


Tipping bucket record from the Aurora Fire Station 7 gauge
The vertical blue lines in the following plot show the time of the individual bucket tips at Fire House 7; closer horizontal spacings between the lines signify higher rain fall rates. As indicated by the thin grey line, the observed rain fall rate in the 1725 - 1735 UTC period was approximately 58 mm / hr. Using a typical S-band rain fall rate estimator such as with a value of 0.6 deg / km yields a rain rate of 32 mm / hr. The numerical coefficients used in many radar-based rain rate estimators are subject to underestimation errors when the raindrop size population is biased towards smaller diameters with more spherical shapes. Also, even at this low elevation angle, the radar sample volume is centered nearly 1 km AGL at the gauge's 84 km range. The size distribution and fall trajectories of the rain drops probably varied between the three-dimensional locations of the radar and surface observations.


Summary
Sounding data collected at Denver indicated that an unusually moist airmass of a tropical nature was over northern Colorado when a several day long episode of flooding rain occurred during the 11 - 13 September 2013 period. The convective rain that developed in this airmass appeared to be characterized by drop size distributions that were shifted towards smaller, less oblate diameters. The presence of such drop size distributions can cause a low bias in both dual polarization and conventional Zh based rain rate estimators. Analyses of more of the flooding event's history at a greater number of gauges are necessary to properly correlate the rain accumulations developed from the surface and radar observations.