Initial Performance Evaluation of the Dual Offset Feed Antenna
This article illustrates the high quality of dual-polarized data available from the CSU-CHILL radar system after installation of the new 8.5 m Dual-offset antenna. Measurements of stratiform rainfall are used to highlight the characteristics of the antenna and radar.
Introduction
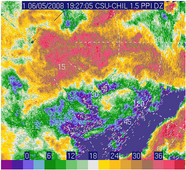
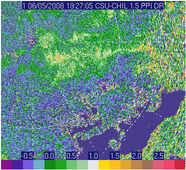
To illustrate the quality of the recently acquired measurements with the new antenna, we show data acquired from one low elevation angle sweep at short ranges (range from 5 to 30 km; azimuth sector from 105-180°) in stratiform rain with embedded convection which occurred on June 5, 2008. The CSU-CHILL radar was operated in the alternating (VH) mode with the two transmitters firing alternately. The copol signals are routed to the copol receiver and similarly with the xpol signals. Fig. 1(a) shows the PPI sweep of reflectivity at elevation angle of 1.5 deg. Fig. 1(a) shows the corresponding differential reflectivity.
|
|
| Fig. 1(a) Reflectivity () | Fig. 1(b) Differential Reflectivity () |
Differential Reflectivity vs Reflectivity
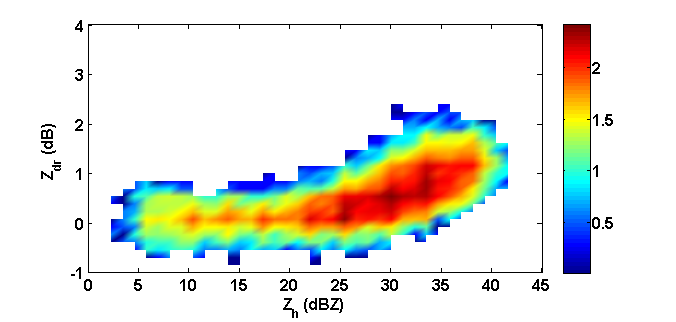
To set the baseline for the data quality we show in Fig. 2 the color-filled plot of versus with frequency of occurrence of pairs of (,) shown on a logarithmic scale. The data were recorded with 3/8th dB steps and for it was 3/16th dB. However, the powers have been recorded with much greater precision (double-precision floating point). The data shown are from each 150 m range gate and have been clutter filtered. The data has also been corrected for receiver noise. A data mask has been applied for each beam using the standard deviation of over 10 consecutive gates with values < 5 deg being classified as 'meteo' echoes. The variation of with falls well within the bounds expected from scattering simulations based on DSDs at S-band. For example, such data can be used to describe 2D-membership functions for fuzzy-logic methods of hydrometeor classification.
Fig. 2: Plot of versus shown as frequency of occurrence of the pairs in a log scale.
Cross Polarization Returns
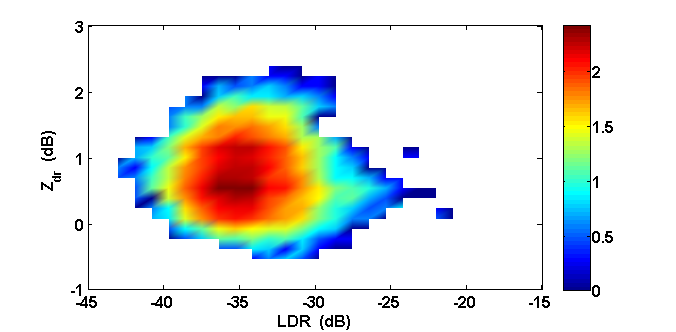
For these same data (except to restrict the range interval from 5 to 20 km), the plot of versus is shown in Fig. 3. The power in the cross-polarization channel has been corrected for noise. In addition, only data where the cross-pol power is > 3 dB above noise have been used for computing .
Fig. 3: As in Fig. 2 except plot of versus .
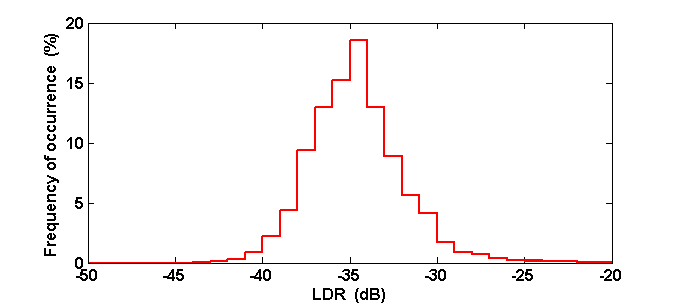
The maximum frequency of occurrence of the pair (,) for this stratiform rain event is around (0.5, -35 dB). The histogram of for this dataset is shown in Fig. 4 which indicates that the mode for stratiform rain appears to be -35 dB; it also indicates that the system limit is close to -40 dB (a good 7 dB improvement of the previous center-fed antenna).
Fig. 4: Histogram of in stratiform rain with embedded convection.
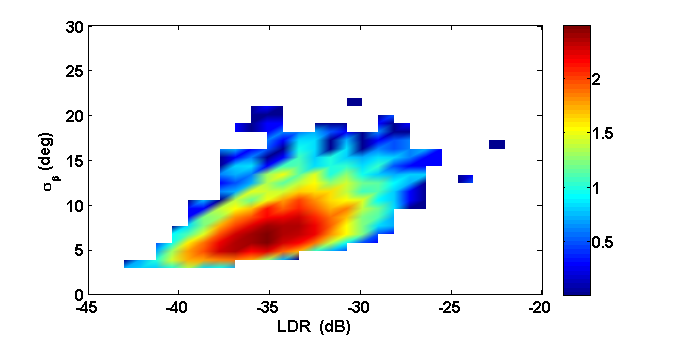
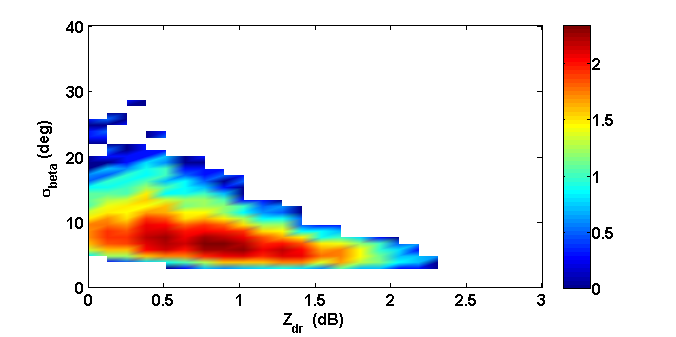
To illustrate how , and can be used to derive the standard deviation of the canting angle, Fig. 5 shows a plot of versus . The assumption is that the canting angle is Gaussian with [0°, ). Also only range gates with >20 dB have been selected to ensure that is not biased by receiver noise. The figure shows that as increases the drops have a larger , as expected. The most probable pairs in this case of stratiform rain with embedded convection lies close to [-35 dB, =7°].
Fig. 5: Plot of the standard deviation of the canting angle ( ) versus in stratiform rain.
Fig. 6 is similar to Fig. 5 except that the X-axis is now . The figure illustrates that the larger and hence more oblate drops are more 'stably' oriented than the smaller ones, again as expected from physical grounds. The modal value lies close to [0.8 dB, =7°].
Fig. 6: As in Fig. 5 except that the X-axis is .
Copolar Correlation Coefficient
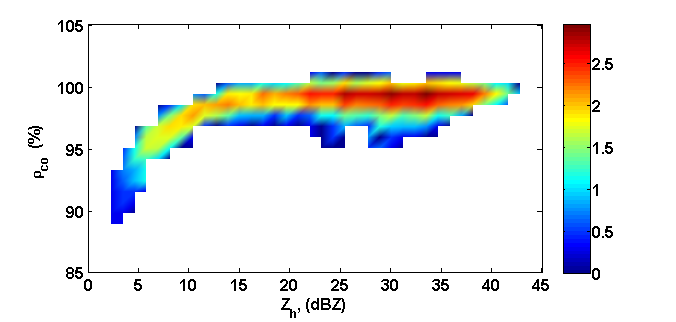
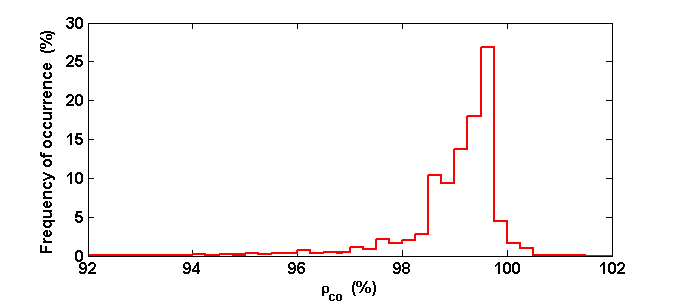
To illustrate the high quality of the copolar correlation coefficient () we show in Fig. 7 the plot of (%) versus noting that the normalizing powers in the expression for have not been corrected for receiver noise. Hence, the drop off in for <15 dBZ. Otherwise, the values are very high approaching 0.995 or higher. This is further illustrated in the histogram shown in Fig. 8 with the mode close to 0.997 (99.7%).
Fig. 7: Plot of versus with the fall off for <15 dBZ due to not correcting the normalizing powers (H and V) for receiver noise.
Fig. 8: Histogram of . Note mode close to 99.7 %. A few occurrences >100% are due to the alternating mode algorithm which assumes Gaussian Doppler spectrum.
Summary
The data analysis illustrates the high quality of the data recorded with the new antenna system.


