Initial CSU-CHILL X-band operations: January 2012
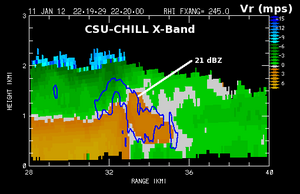
Radial velocities observed in a snow shower during initial testing of the CSU-CHILL radar's newly-added X-Band channel. Plots from additional data sets collected during January, 2012 have been collected.
Introduction
The new X-band addition to the CSU-CHILL radar became operational during the first week of January, 2012. Since that time, efforts have been made to collect basic test data when meteorological echoes have been available. (All echoes observed to date have generally had only low reflectivities). In all cases, both the X and S-Band systems were operated at a PRF of 1 KHz; the X-band system is always in simultaneous H+V transmission mode. Case to case variations in other radar operating parameters are indicated below. (Notes: (1) No special calibration efforts (i.e., sphere flights, etc.) have been undertaken yet, so variations between the X and S-band reflectivities are expected. (2) To maximize the individual pulse volume visualization, all smoothing was turned off in generating the plots. (3) When these data sets were being collected, a varying difference existed between the time stamps applied to the S and X-band data recordings. This error has been corrected.)
11 January 2012 light snow shower
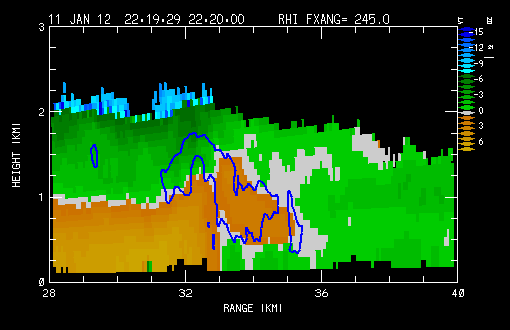
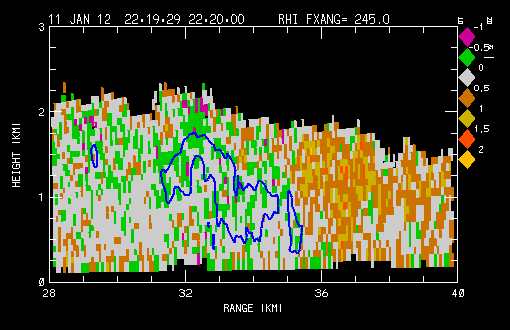
During this operation, both the X and S-band systems were using 150 pulse integrations. The S-band system was in alternating transmit polarization mode. The S-Band peak transmit power was 67.6 kW. The RHI scan shown in the following plot was done at a rate of 1 deg / second. The 21 dBZ level is shown as a solid contour line overlay.
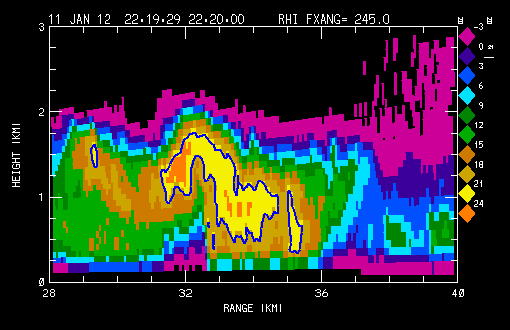
The generally finer scale resolution of the ~0.3 deg beamwidth X-band system is apparent in the following plots. (The X-band gate length is 74 m vs. 150 m in the S-band data). The alternating polarization mode also reduces the number of pulses used to estimate the S-band reflectivities.
S-Band reflectivity:
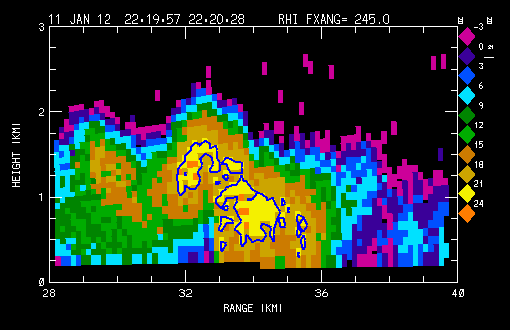
X-Band reflectivity:
X-Band radial velocity
X-Band differential reflectivity
20 January 2012 rain shower
When the data shown below were collected, the S-Band operating mode was changed to VHS (simultaneous) and the pulse count per integration cycle was changed to 64 to match the X-Band system parameters. The S-Band peak transmit power was 131.8 kW. The RHI scan rate remained at 1 deg / sec; the reference reflectivity contour overlay is 21 dBZ. Surface temperatures were above freezing when these data were collected; some hydrometeor melting was occurring near the ground.
S-band reflectivity
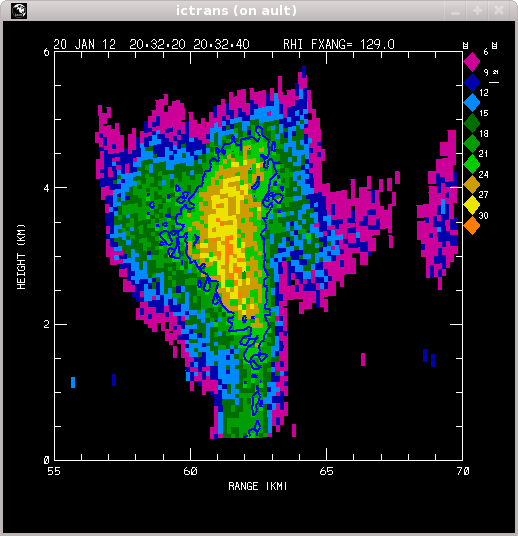
X-band reflectivity
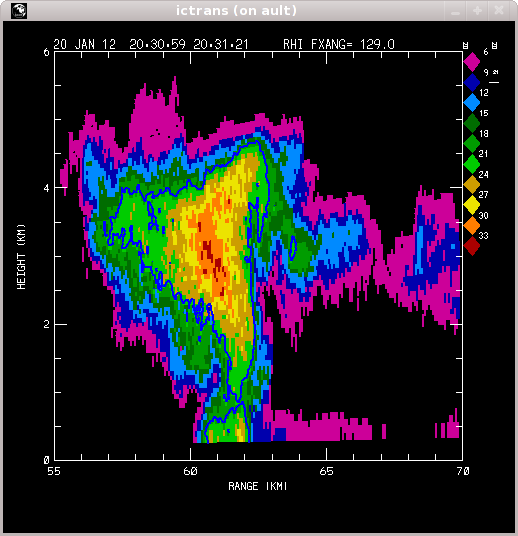
S-Band differential reflectivity
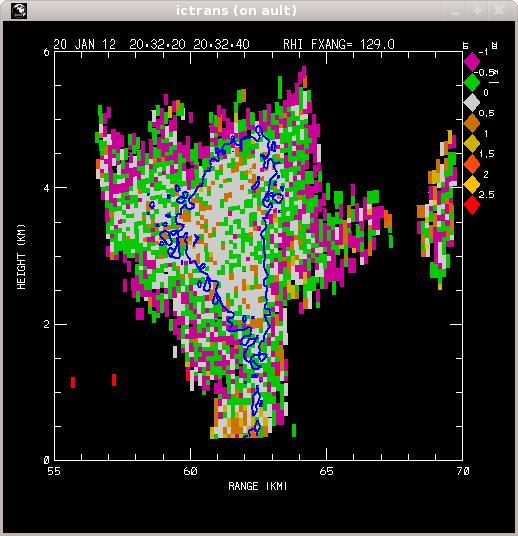
X-band differential reflectivity
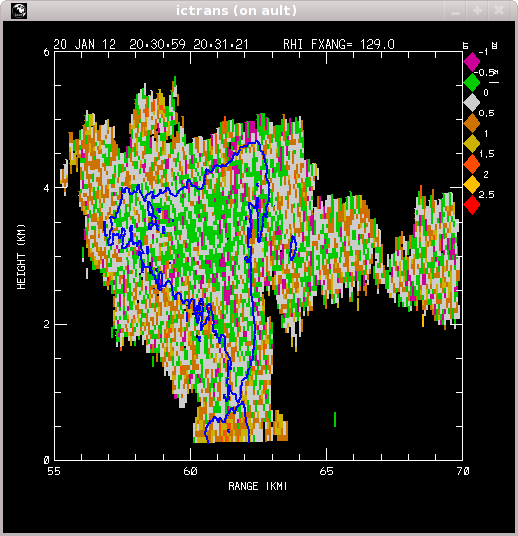
S-band rhoHV
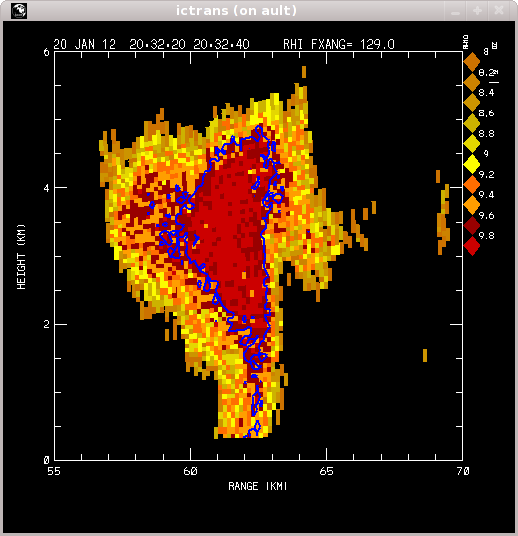
X-Band rhoHV
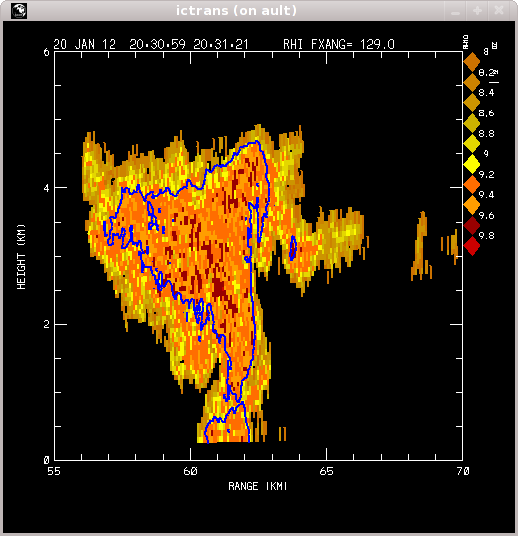
24 January 2012 cloud rolls
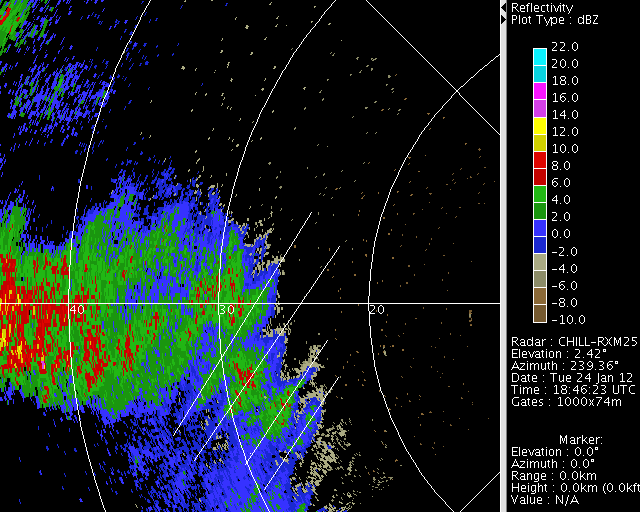
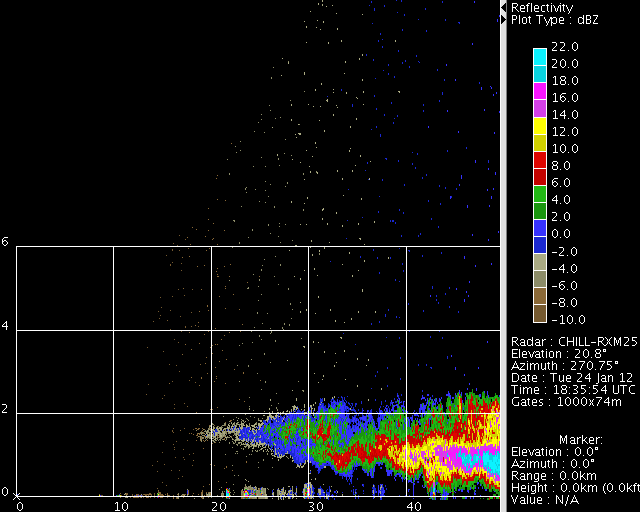
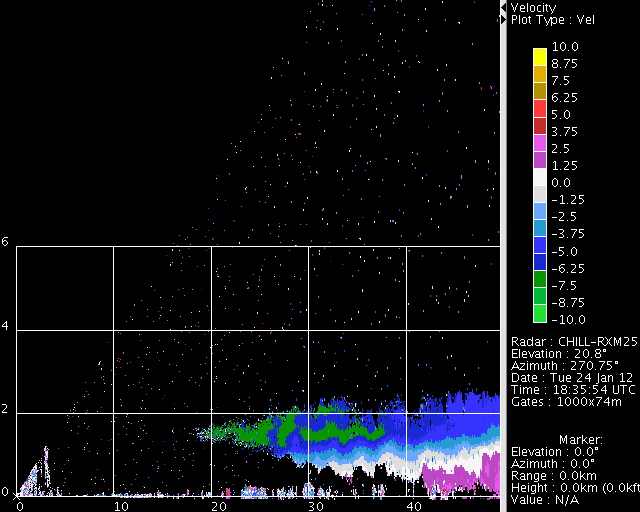
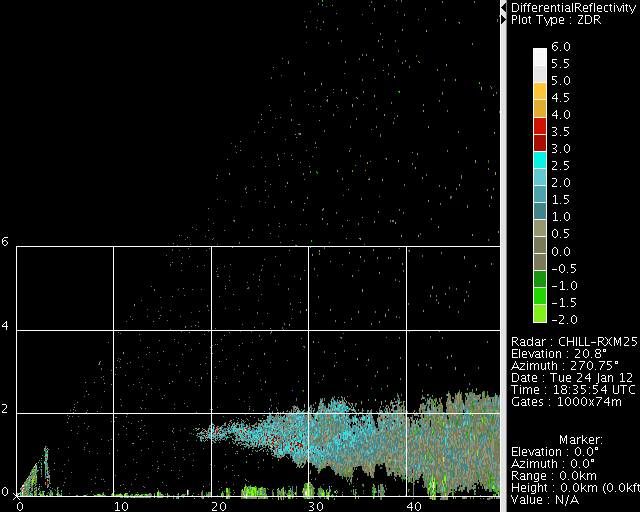
The meteorological data shown on this date are entirely from the X-band system. At the time of the observations, areas of light snow were shrinking as northwesterly flow increased. Immediately downstream of the foothills, the reflectivity pattern contained banded structures that were approximately perpendicular to the average wind direction. The RHI scans also showed evidence of wave-like structures. Roll features were evident in the cloud bases located in the area of the RHI scan.
X-band reflectivity PPI
X-band reflectivity RHI
X-band radial velocity RHI
X-Band differential reflectivity RHI
Cloud bases with roll pattern located to the west of the radar site

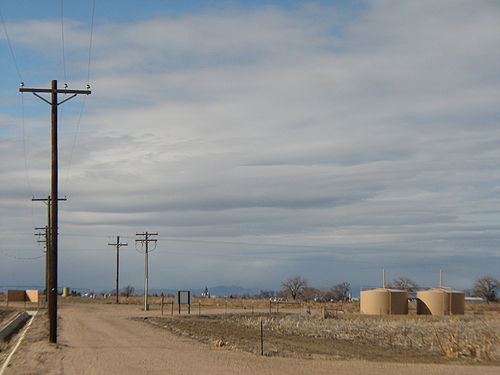
24 January 2012 aircraft targets
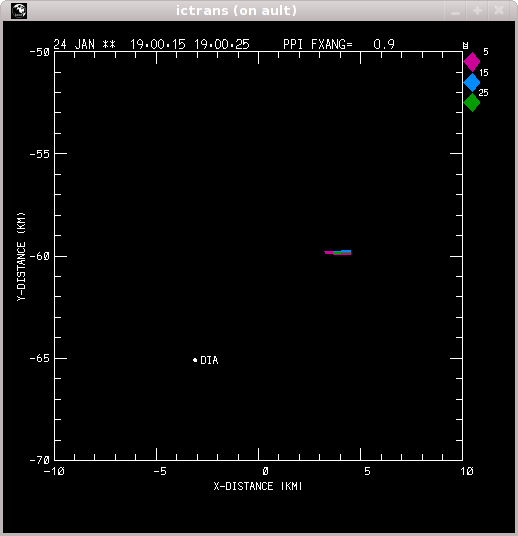
After meteorological data collection was completed on 24 January, scanning was adjusted to observe aircraft targets near Denver International Airport. The following plots show the S and X-Band reflectivity data from a PPI sweep of the airport area. Due to the narrower X-Band beam width, only a single target was detected at 3 cm The 1.0 deg 10 cm wavelength beam resulted in the reception of detectable returns from two additional aircraft. (The S-band system was producing indexed beams at 0.7 degree azimuth intervals. The X-band system was generating outputs at 0.38 degree intervals. This signal processing difference contributes to the wider S-band appearance of the target observed by both of the radars.)
S-Band reflectivity
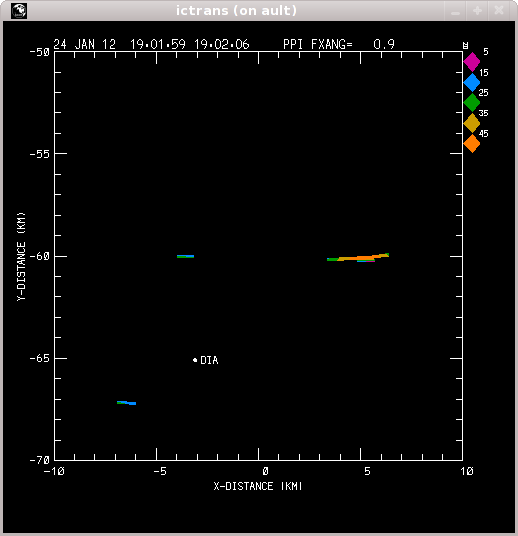
X-band reflectivity
