High Kdp values observed by the CSU-CHILL and KFTG radars: 21 July 2013
Author: Patrick C. Kennedy
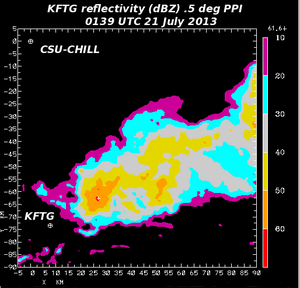
Both the NWS KFTG and CSU-CHILL radars observed one-way specific propagation differential phase () magnitudes of ~8 deg / km in thunderstorm activity on 21 July 2013. Plots of the low level dual-Doppler horizontal wind field and single radar patterns have been prepared.
Introduction
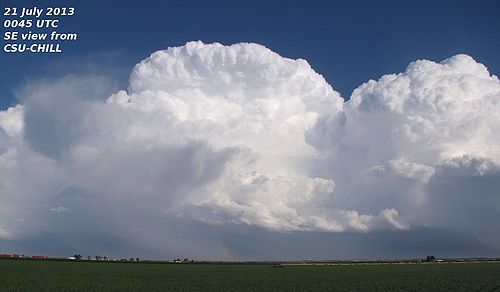
Around 00 UTC on 21 July 2013, cumulus clouds began to develop in the immediate vicinity of the CSU-CHILL radar. By 0045 UTC, the sharply-defined, visually swelling cloud tops indicated that rapid thunderstorm growth was taking place ~30 km southeast of the radar site:
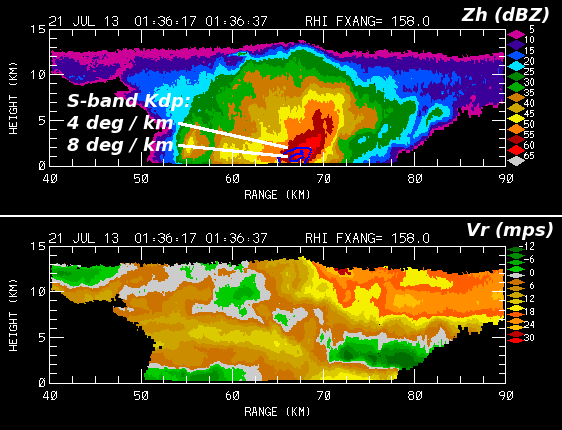
0136 UTC RHI data
By 0136 UTC, the storms had moved out to a range of ~70 km from CSU-CHILL. The following two-panel plot shows the data in the 158° azimuth RHI sweep. The reflectivity structure contained a slightly domed top that extended to ~14 km AGL. Differential propagation phase shifts exceeding 8 deg / km were found in the lowest levels of the echo core. The radial velocity pattern showed that surface outflow maximized ahead of the echo core at ranges beyond 70 km. This leading-edge outflow was surmounted by an inflow layer with inbound (negative in sign) radial velocities. Divergence was evident in association with the echo summit.
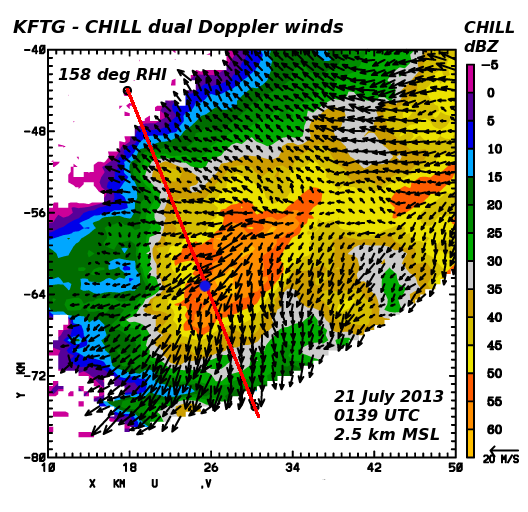
0139 UTC dual Doppler analysis
By chance, the CSU-CHILL and NWS KFTG radars both began PPI volume scans at 0139 UTC. The polar coordinate data from each radar was interpolated with the NCAR SPRINT program to a common X,Y,Z Cartesian grid with the origin located at CSU-CHILL. The vertical grid coordinate is height MSL; terrain height at CSU-CHILL is 1.4 km MSL. The following plot shows the Earth-relative horizontal winds synthesized at an analysis height of 2.5 km MSL. Due to the storm's ~70 km range from CSU-CHILL, this was the lowest usable interpolation height for gridding the CHILL data. The echo core region was associated with divergent flow at this height level. The divergent low level wind flow and heavy precipitation are typical of a mature stage thunderstorm. The solid red line marks the position of the 158° RHI plane. The blue dot along the red RHI line shows the location where the maximum values were observed in the RHI scan shown in the previous section.
Kdp observations by CSU-CHILL and KFTG
The following plots show the reflectivity and data from the PPI scans made by CSU-CHILL and KFTG. was calculated from the recorded differential propagation phase range profiles. [Wang and Chandrasekar 2009:2565-2578] The maximum area was located at distinctly different ranges from the two radars: ~25 km from KFTG and ~68 km from CSU-CHILL. The beam heights in the KFTG 1.3° elevation scan best matched echo core heights sampled in the CSU-CHILL 0.5° sweep. The data from each radar was interpolated to a common 0.5 km mesh X-Y Cartesian grid on the PPI scan surfaces. Due to the shorter range, smaller scale features are more evident in the KFTG data. The CSU-CHILL values reached ~8 deg / km, while the highest KFTG gridpoint value was 9.4 deg / km.
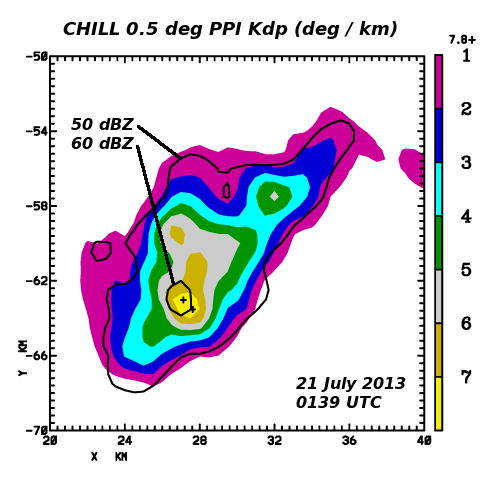
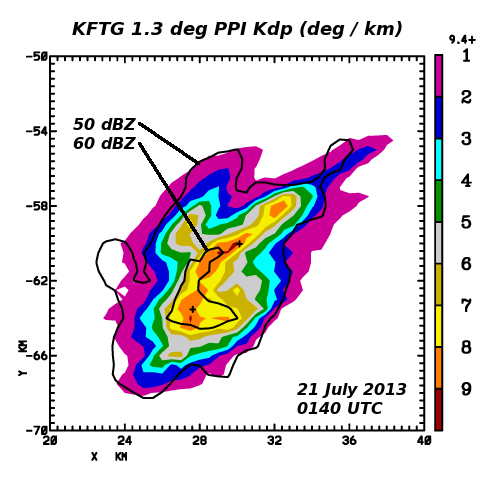
Plots of the KFTG data
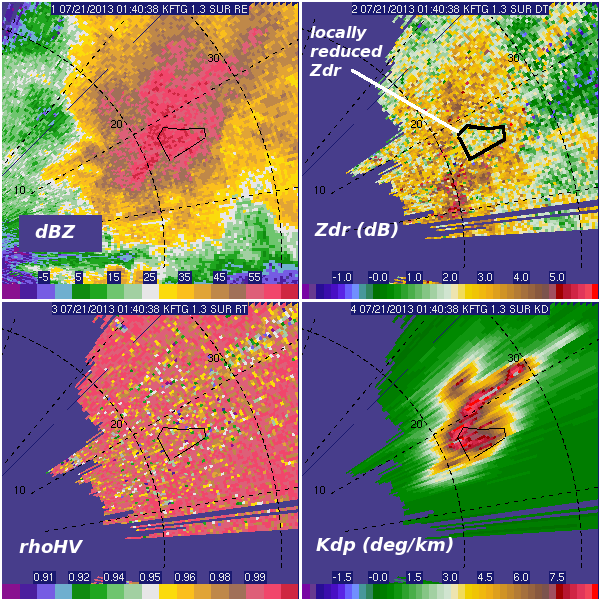
A more detailed view of the KFTG polar coordinate data (without range gate interpolation) was obtained by using the NCAR SOLO display program. An irregular boundary has been drawn around a small area of reduced values in a portion of the reflectivity core. This reduction was probably caused by the presence of quasi-spherical and/or tumbling hailstones within the precipitation shaft. Most of the echo core region had positive values typical of oblate rain drops. The field did not show organized regions of the lowered correlations that are typical of mixed phase hydrometeors. The KFTG dual polarization data fields indicate that the precipitation observed in the echo core at an elevation angle of 1.3° was predominantly rain.
Summary
An area of thunderstorms rapidly developed southeast of the CSU-CHILL radar during the early evening hours of 20 July 2013 (21 July in UTC). The CSU-CHILL and NWS KFTG radars both collected dual polarization data as the storms reached maturation and were producing very heavy rainfall. The radars independently measured one-way magnitudes of 8 - 9 deg / km. Based on S-Band relationships, peak rain rates were on the order of 300 mm / hr (11.8 in / hr; ~1 inch every 5 minutes). Due to the open country in which they occurred, no ground truth rainfall observations were available to confirm these extreme rain rates.
References
- [*Wang and Chandrasekar 2009] Wang, Yanting, V. Chandrasekar, 2009: Algorithm for Estimation of the Specific Differential Phase. J. Atmos. Oceanic Technol., 26, 2565–2578.


