Dual polarization hail signature development at low elevation angles: 27 July 2013
Author: P. C. Kennedy

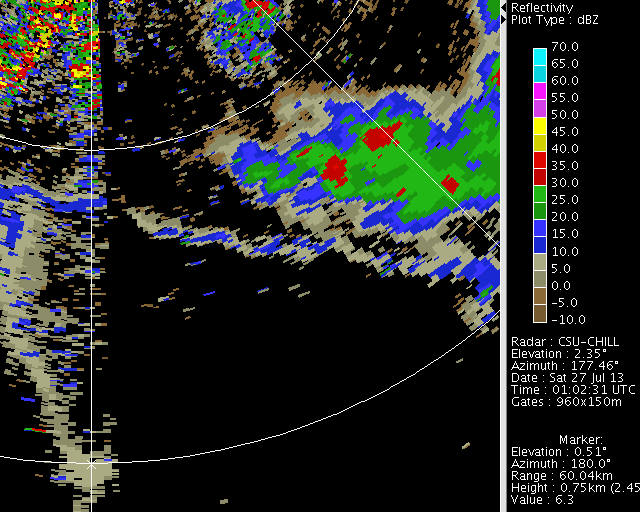
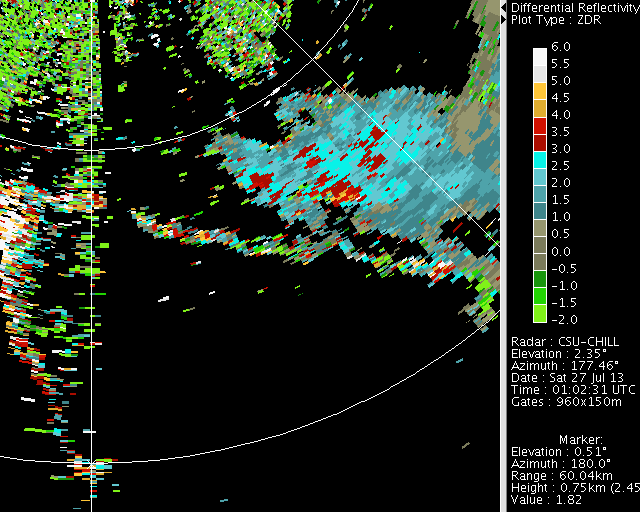
CSU-CHILL S-band (3 GHZ) data collected in a 0.5 degree elevation angle PPI scan of a thunderstorm on 27 July 2013. Differential reflectivity () is reduced to near 0 dB in the echo core due to the presence of hailstones. Time lapse animations of the development of this hail signature have been prepared.

Introduction
During the early UTC hours of 27 July 2013, the CSU-CHILL radar conducted a series of two elevation angle (0.5 and 2.5 degrees) 360 surveillance scans. A scan rate of 6 deg per second was used, producing a volume repetition time of just over 2 minutes. During this scan regime, new thunderstorm cells were developing along an outflow boundary that was located ~40 km southeast of the radar. A sequence of seven 0.5 degree elevation angle PPI scans of CSU-CHILL S-band data captured the initial appearance of dual polarization hail signatures in one of the outflow boundary-triggered cells.
Reflectivity loop
The first loop contains the reflectivity data collected in the 0101:29 through 0114:01 UTC volume scans. The peak reflectivity levels increase ~10 dB (one complete color change) during each 2 minute time step. Reflectivity values greater than 60 dBZ appear in the sixth time step (~0113 UTC). (Note: The elevation angle shown in the image frame annotations reflects the antenna's upward movement towards the second sweep. The plotted data were collected at an elevation angle of 0.5 degrees.)
|
|
||
|
Differential reflectivity loop
The corresponding differential reflectivity () evolution is shown in the following image loop. During the initial time steps, the precipitation is primarily composed of raindrops that are large enough to develop oblate cross sections due to aerodynamic forces. These flattened mean shapes increase the strength of the horizontally-polarized (H) received signal relative to the vertically-polarized (V) return, yielding a positive value. In the later periods when the echo core intensity exceeds ~55 dBZ, an area with levels reduced to ~0 dB appears. This tendency towards equalized H and V received signal levels is due to the increasing numbers of quasi-spherical and/or tumbling hailstones. [Wakimoto and Bringi 1988:1521-1539]
|
|
||
|
Copolar correlation () loop

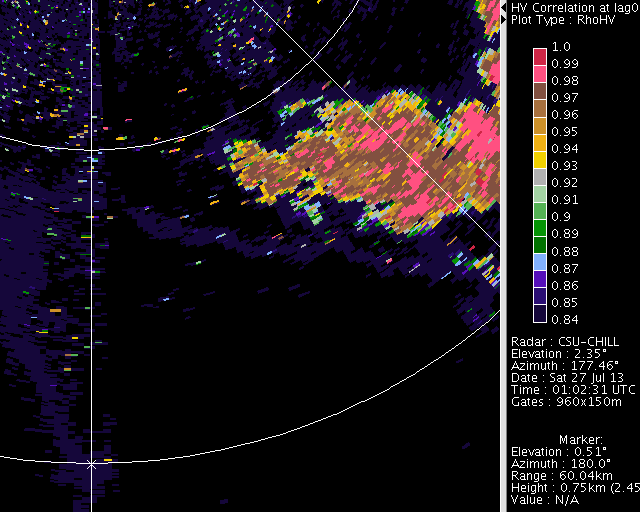
As the hailstones mix with pre-existing rain shaft, the distribution of hydrometeor shapes, orientations, and thermodynamic phases within the radar pulse volumes broadens. This increased diversity among the backscattering particles reduces the correlation coefficient between the H and V received signals (). If Mie scattering effects become significant due to large hailstone diameters, more pronounced reductions will occur. In these S-band measurements, the minimum correlation values were ~0.90 within the hail area.
|
|
||
|
Specific propagation differential phase () loop

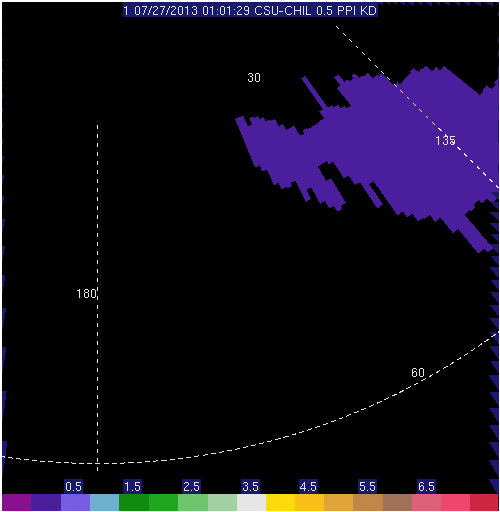
The combined effects of the oblate portion of the hydrometeor population (aerodynamically-deformed liquid drops and melting small hail / graupel particles stabilized by a ring of melt water around their horizontal mid-line) retard the received phase of the H signal relative to that of the V signal. This phase shift between the H and V returns (differential propagation phase () accumulates most rapidly in the portions of the beam path where the oblate particle concentrations are highest. Beam segments where the phase shift is rapidly developing can be identified by calculating the range derivative of (specific propagation differential phase; ). The time evolution of the field is shown in the following loop. By the final frame in the loop, values reach ~6 degrees / km, implying rain rates of ~175 mm per hr (7 inches per hour).

|
|
||
|
0123 UTC RHI scan
An RHI scan through the echo core was done at 0123 UTC, approximately 9 minutes after the end of the time lapse loops shown above. The field is shown by the color filled values in the following plot. The 50 and 60 dBZ reflectivity contour lines are shown as an overlay to locate the echo core. The smaller diameter hydrometeors surrounding the core completely melt as they fall into the above freezing temperatures within ~3 km of the ground. The resultant liquid hydrometeors assume oblate equilibrium shapes and thus generate positive values. The larger hailstones in the echo core do not melt and retain their quasi-spherical, relatively random orientations. This causes the near 0 dB levels to extend downward to the surface within the hail-bearing region of the echo core.

Summary
The ability to measure , , and that is provided by dual polarization weather radars greatly aids the identification of hail within thunderstorm precipitation. Efforts to exploit these capabilities using the upgraded dual polarization NWS radar network are underway [Ryzhkov et al 2013:2871-2886].
References
- [*Wakimoto and Bringi 1988] Wakimoto, Roger M., V. N. Bringi, 1988: Dual-Polarization observations of Microbursts Associated with Intense Convection: The 20 July Storm during the MIST Project. Mon. Wea. Rev., 116, 1521–1539.
- [*Ryzhkov et al 2013] Ryzhkov, Alexander V., Matthew R. Kumjian, Scott M. Ganson, Pengfei Zhang, 2013: Polarimetric Radar Characteristics of Melting Hail. Part II: Practical Implications. J. Appl. Meteor. Climatol., 52, 2871–2886.