Dual-Doppler observations of a Bounded Weak Echo Region (BWER): 17 June 2013
Author: P.C. Kennedy
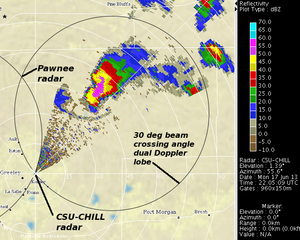
17 June 2013 CSU-CHILL S-Band reflectivity data in a 0.5 degree elevation angle PPI scan through a thunderstorm located in the east lobe of the dual Doppler network formed with the Pawnee radar. At higher altitudes, a Bounded Weak Echo Region (BWER) was present in this storm. Selected three dimensional wind fields from the BWER area have been prepared.
Introduction
The CSU-CHILL and Pawnee radars synchronized the starting times of their PPI volume scans in support of a 20hr project on thunderstorm electrification and microphysics conducted during June - July 2013 for Mr. Brody Fuchs (a graduate student in the CSU Atmospheric Science Department). At 2205 UTC on 17 June 2013, an isolated storm was located well within the eastern dual Doppler lobe. The resultant large beam crossing angles allowed accurate syntheses of the three dimensional airflow fields from the basic radial velocity observations. The results of a "first look" dual Doppler analysis are shown in the following series of plots.
0.5 degree elevation angle PPI data
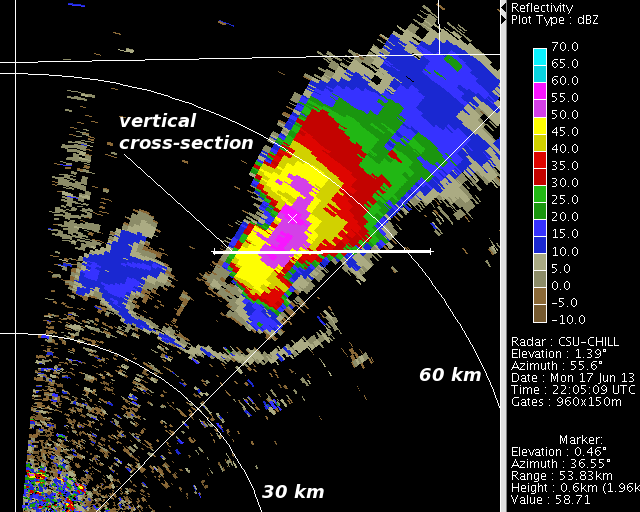
The storm had been producing precipitation at the surface for some time as it entered the east lobe. At 2205 UTC the maximum reflectivity values exceeded 50 dBZ in the low-level core area. A fine line echo associated with the storm's outflow was also evident.
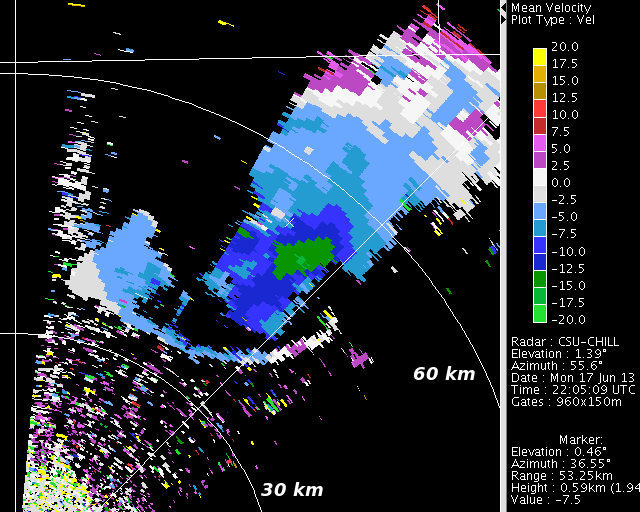
Negative radial velocities (i.e., inbound to the radar) were prominent along the southeastern edge of the reflectivity core and in most of the fine line echo.
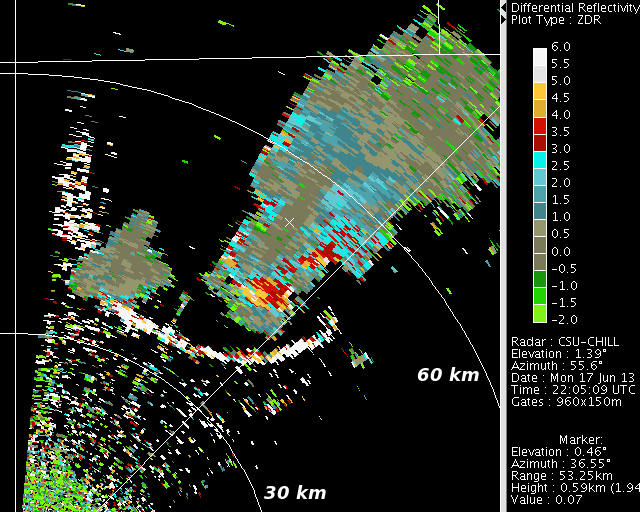
Differential reflectivity () values decreased to ~0 dB in the echo core, indicating the presence of enough quasi-spherical and/or tumbling hailstones to equalize the horizontally and vertically-polarized received signal strengths. In the surrounding rain areas, the precipitation was mainly composed of oblate drops, causing the H polarized received signal level to exceed the V signal level and making become positive. The largest positive levels were found along the fine line where many of the scatterers were insects with significantly flattened body shapes.
Dual Doppler analyses
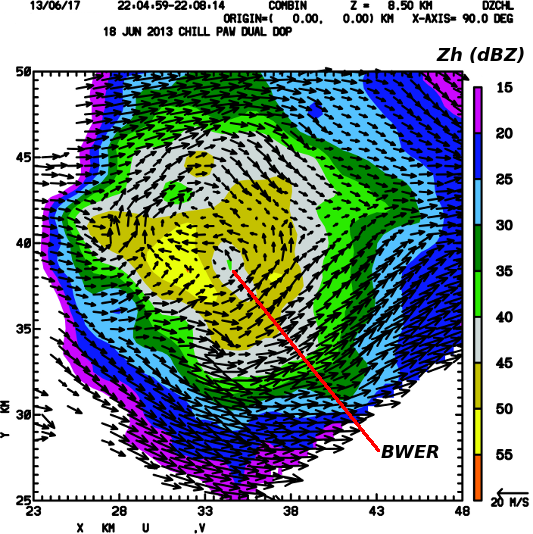
The polar coordinate data from each of the radars was interpolated to a common set of Cartesian gridpoints with a 0.5 km mesh size in each direction. (This interpolation was done using NCAR's SPRINT (Sorted Position Radar INTerpolation) software. The three dimensional wind field components were synthesized from the gridded data using NCAR's CEDRIC (Custom Editing and Display of Reduced Information in Cartesian space) programs. The following plot shows the Earth-relative horizontal wind field and CSU-CHILL reflectivity field at the 8.5 km MSL height. A distinct local reflectivity minimum occurred near X=25, Y=39 km (the grid origin is CSU-CHILL). Such Bounded Weak Echo Regions (BWERs) are associated with strong updrafts (Marwitz and Berry, June 1971 JAM) in thunderstorms. The magnitude of the horizontal winds was relatively low in the vicinity of the BWER. This was probably due to the lower horizontal momentum air that was being transported to the 8.5 km MSL level by the updraft. Accelerated wind speeds were found where the ambient westerly flow deviated around the northern and southern edges of the echo.
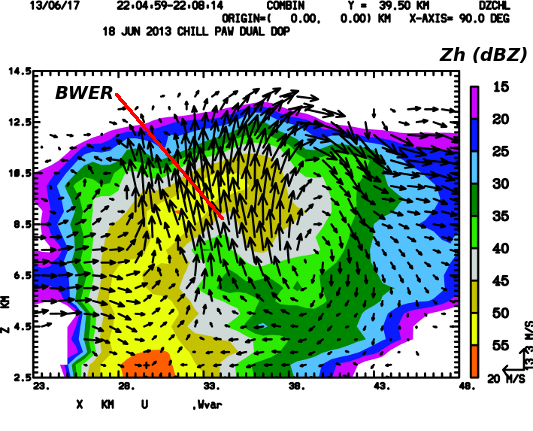
The following plot shows an east - west oriented vertical cross section located at Y = 39.5 km. (The location of this cross section included in the 0.5 degree elevation angle reflectivity PPI shown earlier). In this plane, the BWER appears as an upward-directed indentation into the overhanging reflectivity pattern centered at ~X=35 km. The overhanging structure also contained the primary updraft at heights above approximately 6.5 km MSL. Hydrometeors growing in the strong updraft were carried to appreciable heights before their diameters and radar cross sections became significantly large. As a result, the reflectivity contours were displaced upwards to higher altitudes in the vicinity of the strong updraft.
Summary
The three dimensional airflows obtained from dual Doppler processing of CSU-CHILL and Pawnee data can enhance the understanding of the internal organization of thunderstorms. This knowledge of storm organization will aid the analysis of the polarimetric radar data collected at S and X-Bands as well as the Lightning Mapping Array (LMA) data that are also being recorded during this 20 hour project.
