DPWX/Zdr regimes in echoes from insects and raindrops: 1 July 2015
Author: Patrick C. Kennedy

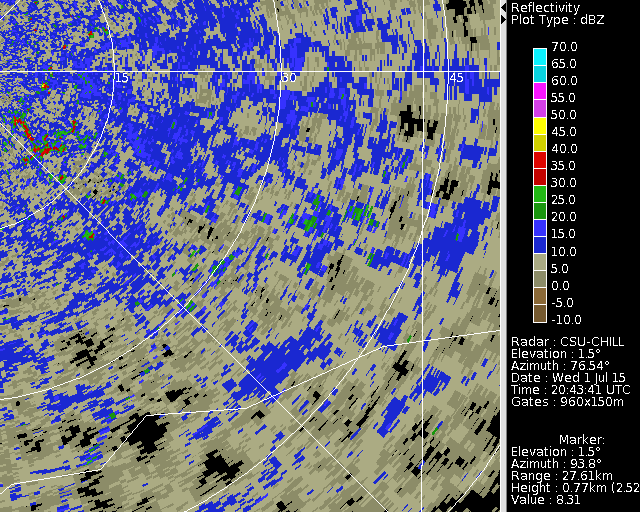
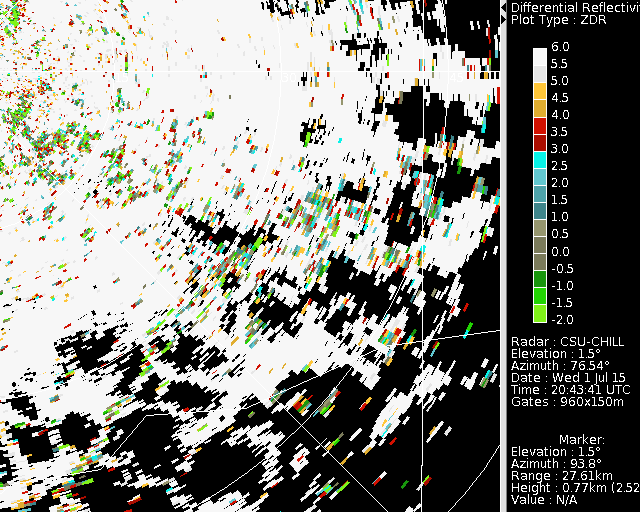
CSU-CHILL S-band data from a 1.5 deg elevation angle PPI scan in the afternoon hours of 1 July 2015. The drops in a small rain shower have differential reflectivity (Zdr) levels of 2 - 3 dB. Much more positive (approximately +9 dB) Zdr values occur in the surrounding boundary layer echo where the targets are primarily insects. Time lapse loops showing the evolution of the low-level Zh and Zdr fields have been prepared.
Overview
During the afternoon hours of 1 July 2015 the CSU-CHILL radar conducted continuous 360 degree surveillance scans at a single elevation angle (1.5 degrees). This scan pattern provided high time resolution (~1 minute and 30 seconds) updates on the evolution of the low level echo field. During the observation period, rain shafts from developing thunderstorms penetrated downwards into the insect-laden boundary layer.
Reflectivity loop
In the following reflectivity sequence, the widespread horizontally uneven coverage of modest reflectivity (~10 - 20 dBZ) echoes is typical of a convectively-active warm season boundary layer. These non-precipitating clear air echoes are carried towards the west by the low level synoptic wind field. As time progresses, isolated higher reflectivity rain echoes appear from thunderstorms that are developing at higher levels. The westerly winds at these higher levels cause the rain echoes to move opposite to the boundary layer echo motion.
|
|
||
|
Zdr loop
The next loop shows the differential reflectivity (Zdr) data from the same sequence of images. The clear air echoes are characterized by highly positive (~ +6 dB) Zdr values. These magnitudes are typical of the insect's very oblate body shapes. The mean shapes of the raindrops in the developing precipitation shafts are less flattened than the horizontal profiles of the insect bodies, resulting in less positive (~ +2 dB) Zdr values. Brief episodes of higher Zdr levels appear in the rain showers during the higher reflectivity periods when larger diameter, more oblate drops are present.
|
|
||
|
KFTG data
Since the CSU-CHILL radar was only conducting low elevation angle scans, volume scan data from the NWS KFTG radar located in the Denver area (~75 km south-southeast of CHILL) was used to determine the vertical structure of the rain shower echoes. The following image, generated by the GR2Analyst program, shows the reflectivity field at the lowest elevation angle in the 2139:01 UTC volume scan. The convective shower echo core reached reflectivity levels of ~45 dBZ amidst the more widespread, weaker boundary layer echo.

The final plot is a 3D visualization of the same convective echo as rendered by GR2Analyst. The tilt of the echo core towards the southeast with height is apparent. This configuration is the result of the differential advection generated by the change in wind directions from easterly in the boundary layer to northwesterly in the mid-troposphere.
