DPWX/Zdr evolution in snow showers: 26 October 2017
Author: Patrick C. Kennedy

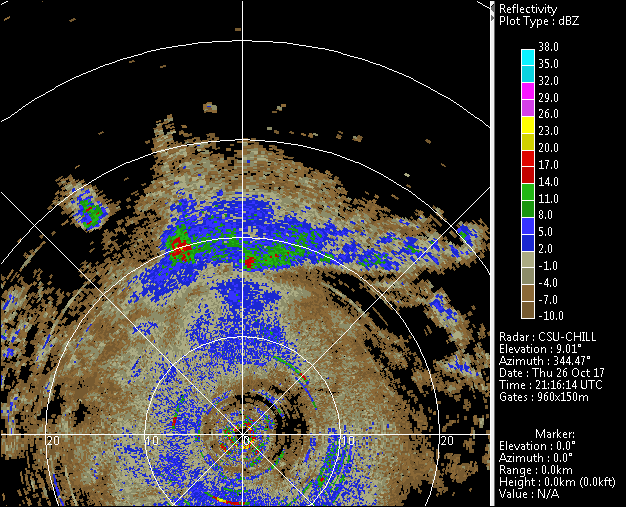
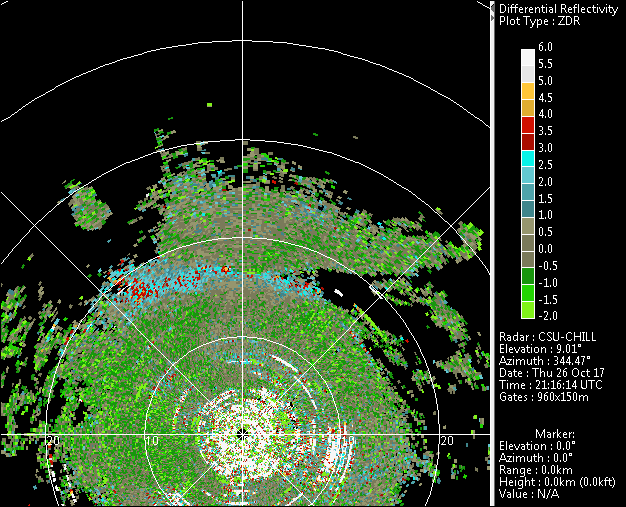
Showers, primarily snow, as seen in the reflectivity data collected by the NWS Cheyenne, WY radar in a 0.5 deg elevation scan on 26 October 2017. The CSU-CHILL radar collected continuous 9 deg elevation surveillance scans during this same time period. Differential reflectivity variations of several dB were observed in the snow showers near the CSU-CHILL radar.
Overview
During the afternoon hours of 26 October 2017, an unstable airmass was in the vicinity of the CSU-CHILL radar following a morning cold frontal passage. Local showers developed in this environment. At the radar site, surface air temperatures were just above freezing (+3 to +4 C), the precipitation was a mixture of light snow and rain. Ground temperatures were above freezing and no snow accumulation occurred.
9 degree elevation angle PPI image loops
To monitor the evolution of near-range echo at upper levels, the CSU-CHILL conducted continuous surveillance scans at an elevation angle of 9.0 degrees. The scan rate of 6 degrees per second provided an essentially once per minute update rate. The following image loop shows the reflectivity data in the 9 degree elevation scans conducted between 2116 and 2200 UTC. The general echo motion from the west-northwest in the post-frontal flow is apparent. One feature of particular interest is the new echo that initially develops near the 20 km range ring in the northwest azimuth quadrant. With time, this echo intensifies to > 14 dBZ (red) reflectivity and moves to closer ranges and lower heights.
|
|
||
|
The second loop shows the corresponding differential reflectivity (Zdr) data. The developing echo area in the northwest azimuth quadrant is initially characterized by distinctly positive Zdr levels in the +4 to + 6 dB range. During the subsequent period of reflectivity intensification, the Zdr values decrease rapidly towards 0 dB. This process results in the intensifying echo transitioning to a low Zdr "hole" within the surrounding echo area. Zdr is a measure of the reflectivity-weighted mean axis ratio of the backscattering particles in the radar pulse volume. Thus, the Zdr decrease from the hydrometeors in the intensifying snow shower indicates a transition towards some combination of less oblate (i.e. more spherical) particle shapes and more random orientations. This pattern is consistent with the aggregation of individual planar ice crystal forms into more irregularly shaped, larger aggregates. (The reduced bulk density of the aggregate's air / ice composition also tends to reduce Zdr).
|
|
||
|
KCYS reflectivity data
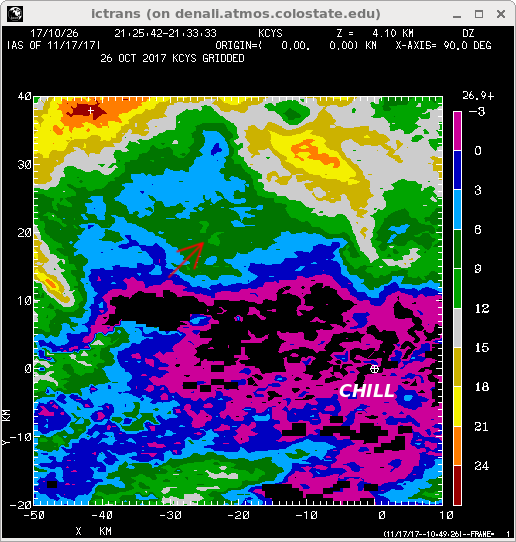
Due to the steep inclination of the CHILL's 9 degree PPI scan plane, data from several volume scans made by the NWS Cheyenne radar were interpolated to a conventional constant height level grid point network. The following image sequence shows the KCYS reflectivity data at the 4.1 km MSL (2.7 km AGL) height level. This is the approximate height where the highly positive Zdr echo first appeared 20 km northwest of the CHILL radar. The reflectivity sequence shows that the small echo region of interest (marked by an arrow) intensified to ~ 18 dBZ by the final time (~2155 UTC). (Due to the coarse (~10 minute) time steps, it is useful to click the Fwd / forward screen button to step through the image frames.)
|
|
||
|
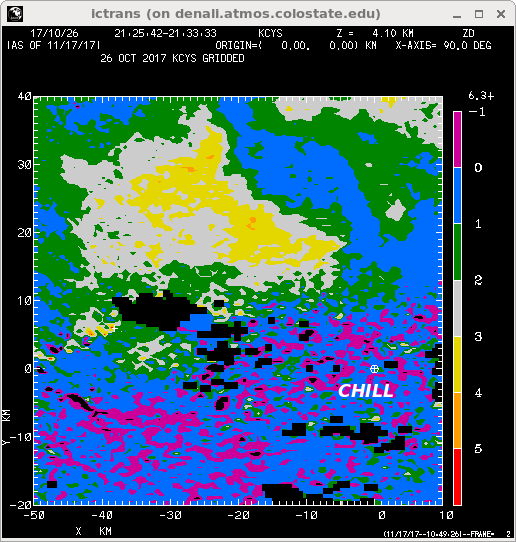
The next loop depicts the corresponding KCYS Zdr data loop. The development of a low Zdr "hole" in association with the increasing reflectivity in the echo of interest is apparent.
|
|
||
|
2235 UTC RHI scan data
Approximately 40 minutes after the end of the image loops shown above, the CSU-CHILL radar conducted an RHI scan on an azimuth of 335 degrees. This scan provided a general example of a vertical cross section through the snow shower activity. The reflectivity data shows that the echo was primarily organized into an elevated layer with the highest intensities located between 2 and 3 km AGL. In the lower plot panel, the more positive Zdr values generally occur in the more tenuous, lower reflectivity regions, especially at echo top heights and at ranges beyond ~25 km.

Another view of the association of positive Zdr values with lower reflectivity levels is shown in the scatterplot generated from the RHI scan shown above. The scatterplot input data were obtained by interpolating gate data to a Cartesian grid in the RHI plane with a grid point spacing of 100m in range and height. A red +5 dBZ line has been added as an arbitrary reference; the highly positive (> ~ +4 dB) occur at reflectivity levels below 5 dBZ in this RHI scan. This negative correlation between reflectivity and Zdr in snow at lower tropospheric heights has previously been demonstrated (Ryzhkov and Zrnic, JAM, 1998, p 1228 - 1240).
