DPWX/Thunderstorm outflow boundary: 1 July 2016.
Author: Patrick C. Kennedy

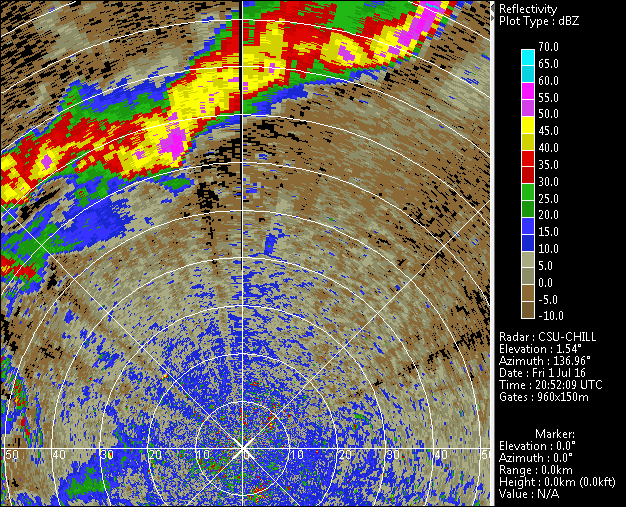
CSU-CHILL S-band reflectivity data in a 1.5 deg elevation angle surveillance scan through a thunderstorm outflow boundary approaching the radar site from the north on 1 July 2016. Time lapse loops of the evolution of this outflow boundary as observed through a sequence of these PPI scans have been assembled.
Overview
During the afternoon hours of 1 July 2016, a line of thunderstorms moved across the northern portion of the CSU-CHILL radar's coverage area. The radar conducted low elevation (5 degree maximum elevation angle) 360 degree surveillance scans during the storm passage time period. These low elevation scans captured the appearance and propagation of a fine line echo along the leading edge of the outflow generated by the storms.
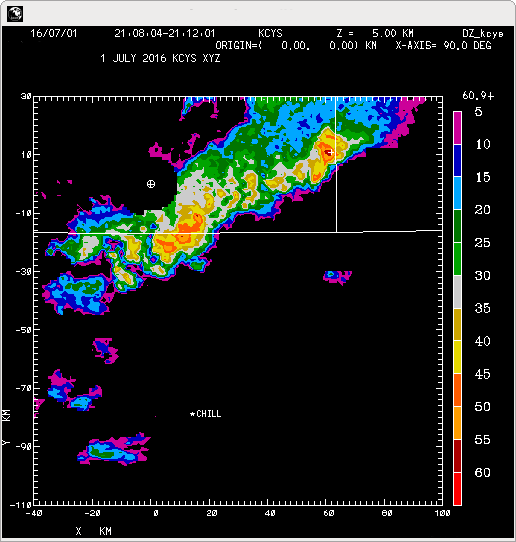
NWS KCYS reflectivity data at 5 km MSL
Volume scan data collected by the NWS WSR-88D radar at Cheyenne, WY (KCYS) was examined to provide an overview of the evolution of the thunderstorm line. The KCYS data from three volume scans that were separated in time by ~45 minutes were interpolated to a common set of Cartesian grid points. The following image loop shows the evolution of the reflectivity field at the 5 km MSL level. (Terrain height is 1.9 km at KCYS and 1.4 km at CSU-CHILL). While some weakening of the echoes occurred at the southern end of the line, the convective system generally remained active as it propagated southeastward.
|
|
||
|
CSU-CHILL reflectivity loop
The following loop shows the reflectivity field observed in the 0.9 deg elevation scans. The time interval between the images is 4:40. The fine line echo along the outflow boundary starts to become defined around 2120 UTC (loop frame 7). By the end of the loop period, this boundary has essentially reached the CSU-CHILL radar site.
|
|
||
|
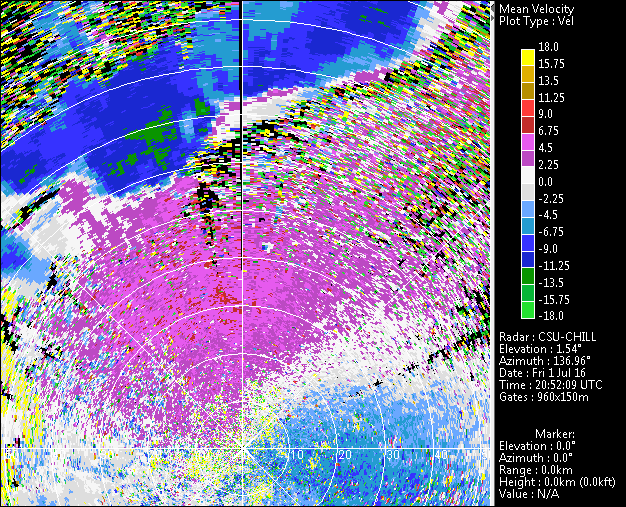
CSU-CHILL radial velocity loop
The next loop shows the corresponding radial velocity sequence. The low level outflow from the storms generates an area of enhanced inbound to the radar (negative in sign) radial velocities. Some flow acceleration also probably occurs as the higher density, rain-cooled air moves along the down-sloping terrain between KCYS and CHILL. Southeasterly ambient flow is indicated in the widespread boundary layer echo located ahead of the outflow boundary.
|
|
||
|
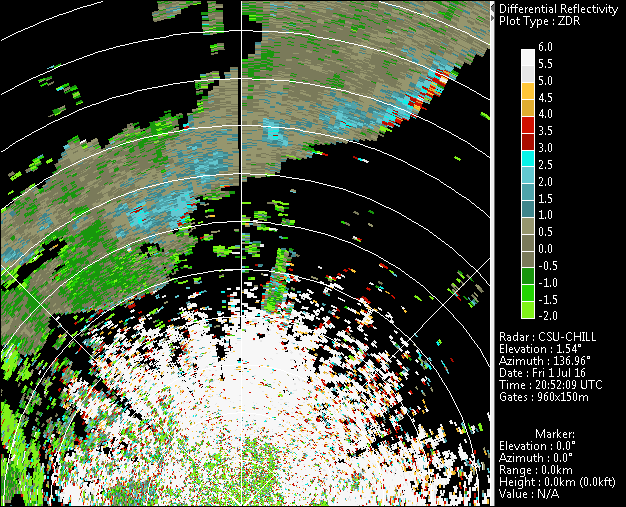
CSU-CHILL differential reflectivity loop
The final loop shows the differential reflectivity (Zdr) data from the same series of PPI scans. The boundary layer echoes are characterized by very positive (> +5 dB) Zdr levels. This is due to the highly oblate body shapes attained by mature insects by this mid-summer date. Within the thunderstorm precipitation, the maximum Zdr values are ~ +3 dB in areas where larger diameter, more oblate raindrops predominate. The thunderstorm outflow sweeps most of the insects away from the leading edge of the precipitation. These advected insects become spatially concentrated by the convergent wind field along the leading edge of the outflow. The enhanced concentration of scatterers along the outflow boundary is a major contributor to the radar echo that appears along the outflow boundary.
|
|
||
|