DPWX/Surface divergence and heavy rainfall beneath a thunderstorm: 19 June 2014
Author: P. C. Kennedy
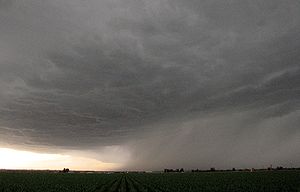
A thunderstorm's heavy precipitation area passes to the south of the CSU-CHILL radar site at 0018:39 UTC on 19 June 2014. The NCAR S-Pol and CSU-CHILL radars conducted synchronized volume scans of this storm during the North Carolina State University Radar Observations of Storms for Education (ROSE) project. A dual-Doppler synthesis of the divergent horizontal wind field that was present at low levels in this storm has been generated.
Introduction
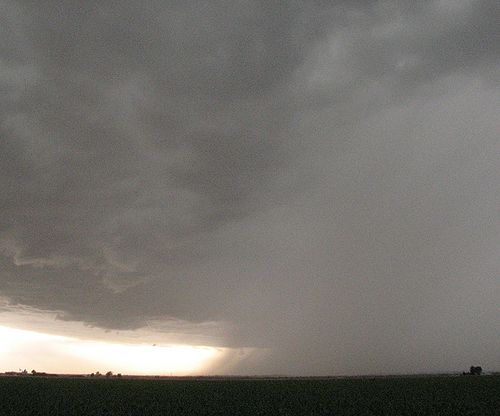
The Radar Observations of Storms for Education (ROSE) project, was conducted by Prof. Sandra Yuter (North Carolina State University) between 20 May and 20 June 2014. A central element in the project was the execution of synchronized 360 degree surveillance volume scans by the NCAR S-Pol and the CSU-CHILL research radars. During the early UTC hours of 19 June 2014, a strong thunderstorm crossed the baseline connecting the two radars and emerged into the eastern dual Doppler lobe. The following photograph of the storm was taken looking southeast from the CSU-CHILL radar site at 0035 UTC. The sloping profile of the precipitation shaft suggests that outflowing winds were present near the surface:
Dual Doppler analysis
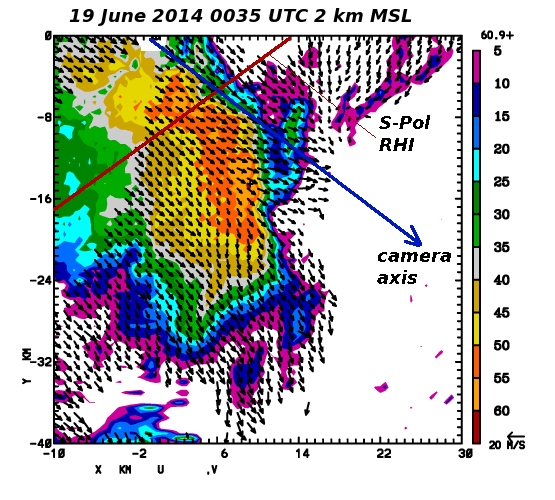
The S-Pol and CHILL interleaved volume scans that started at 0033:20 and 0036:20 UTC were used to synthesize the low level horizontal wind field. Manually edited versions of the input polar coordinate observations were interpolated to a 500 m mesh 3D Cartesian grid using the NCAR Radx2Grid program. The NCAR CEDRIC program computed the u, v wind components from the Cartesian input files. The vectors in the following plot show the Earth-relative horizontal winds at the 2 km MSL height level (~600 m AGL). In agreement with the photographic data, divergent horizontal flow existed in association with the high reflectivity echo core.
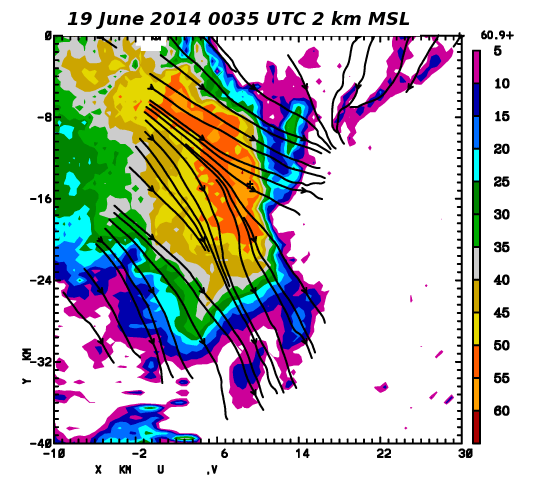
The next image shows the same flow field represented by streamlines. The horizontal spreading of the streamlines is most apparent near the leading (eastern) edge of the echo core.
S-Pol RHI data
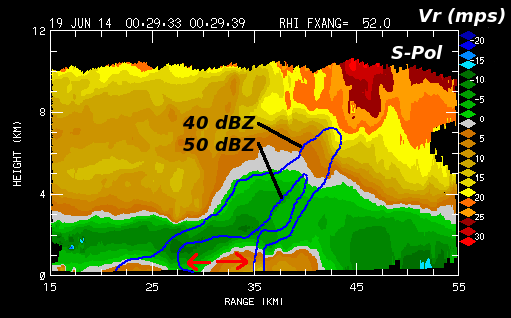
The S-Pol radar conducted an RHI scan through the storm on an azimuth of 052 degrees at 0029 UTC (approximately 6 minutes before the time of the preceeding dual Doppler analysis). In the following plot, the unfolded radial velocities are shown as a color-filled field. The 40 and 50 dBZ reflectivity contours locate the echo core. As highlighted by the pair of red arrows, the RHI plane radial velocities imply the existence of divergence in the lowest levels of the echo core.
Specific differential propagation phase ()
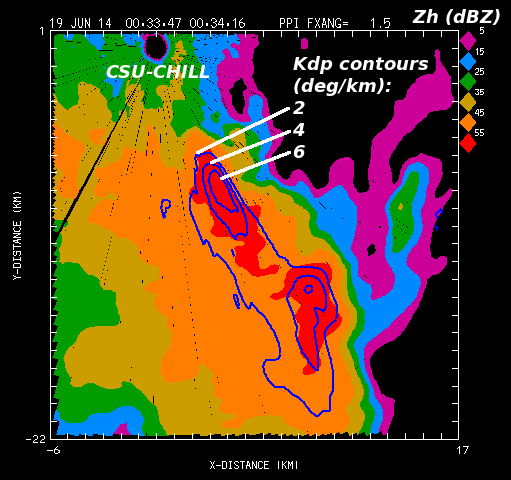
Visually, the storm's precipitation shaft was quite dark and opaque. Specific differential propagation phase () data from the nearby CSU-CHILL radar was used to get a sense of the instaneous rainfall rates. Kdp, the range derivative of differential propagation phase (), maximizes in the segments of the radar beam path where high concentrations of oblate raindrops exist. The contour lines in the next plot show the one-way values in the CSU-CHILL 1.5° PPI scan. These 3 GHZ (S-band) magnitudes of ~5 deg / km imply that rain rates on the order of 200 mm / hr existed in the rain shaft.
Summary
Via the FRONT network, the ROSE project collected a number of useful data sets. Several aspects of the thunderstorm lifecycles should be resolvable in the 18 - 19 July 2014 radar observations.

