DPWX/Spectral width in an outflow boundary: 12 July 2018
Author: Patrick C. Kennedy

X-band reflectivity data in a 1.5 degree elevation angle PPI sector scan through an outflow boundary approaching the CSU-CHILL radar site on 12 July 2018. Detailed features of the outflow boundary are presented in a time lapse loop assembled from a series of RHI scans taken as the boundary reached the radar.
Overview
During the afternoon hours of 12 July 2018, thunderstorms initially developed over the eastern slopes of the Rocky Mountains, approximately 75 km to the northwest of the CSU-CHILL radar. By 2027 UTC, some of these storms had exited the foothills and moved over the Fort Collins area. The following plot shows the S-band data collected in an RHI scan through the convection over Fort Collins (range ~45 km). The maximum reflectivities were generally located below 3 km AGL, a pattern characteristic of a thunderstorm evolving into the dissipating stage. The corresponding radial velocities (lower panel) show surface-based outflow propagating ~15 km ahead of the echo core.

X-band RHI image loop
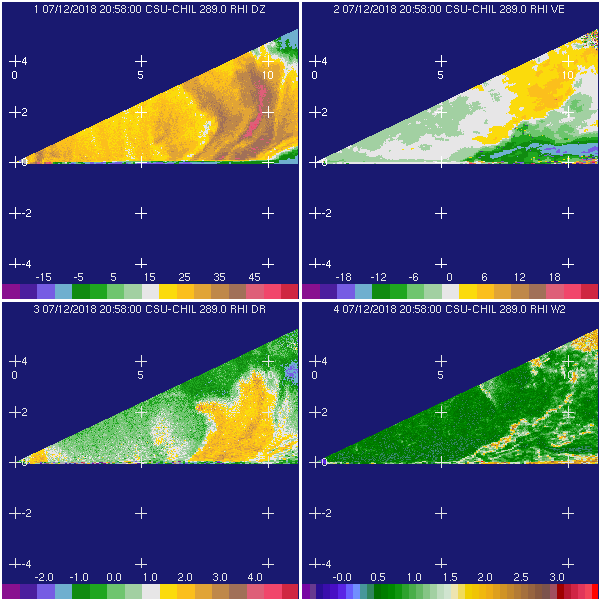
Approximately 30 minutes later, as the leading edge of the outflow approached the radar, scanning was changed to continuous RHI's done on azimuths of 287 and 298 degrees; these scans repeated at intervals of ~1 minute and 47 seconds. These azimuth angles were selected to intercept the maximum inbound radial velocities at near surface levels. The six frame loop covers an approximately 8 minute time period that ends as the outflow reaches the radar. X-band data is presented as the 0.3 degree beam width attained by the CSU-CHILL 8.5 m diameter dual offset feed antenna provides observations at high angular resolution. To present small scale features, the image loop frames only depict data within ~12 km range.
The reflectivity data (upper left) shows the the outflow was advancing through a pre-existing rain area. The reflectivity of the rain area intercepted by the RHI scan decreased with time. The approach of the larger scale thunderstorm outflow is seen in the enhanced inbound radial velocities at near-surface levels (upper right). In concert with the decreasing reflectivity levels, differential reflectivity (lower left) become less positive with time as the average raindrop diameters decrease and their equilibrium shapes become more spherical. Indications of a melting layer appear near 3 km AGL in the final image frame. The spectral width pattern (lower right) suggests that turbulence is enhanced in the high shear zones where the thunderstorm outflow airmass interacts with the ambient environment.
|
|
||
|