DPWX/Passage of a high Kdp area over a tipping bucket rain gauge: 25 August 2014
Author: P. C. Kennedy

Specific differential propagation phase () levels peaked at ~8 deg / km in a 1.8 deg elevation angle PPI sweep made by the NWS KFTG radar on 25 August 2014. Similar values were observed by the CSU-CHILL radar. Plots of the data recorded by a tipping bucket rain gauge during the passage of this high area have been prepared.

Overview
During test operations of the CSU-CHILL radar on the afternoon of 25 August 2014, the core of a strong thunderstorm passed over a tipping bucket rain gauge operated by the Denver Urban Drainage and Flood Control District (UDFCD). Peak one-way specific differential propagation phase () values of ~8 deg / km, indicitave of very high rain rates, were recorded in the immediate vicinity of the gauge. The bucket tip data was used to provide an independent measurement of the storm's rain rates.
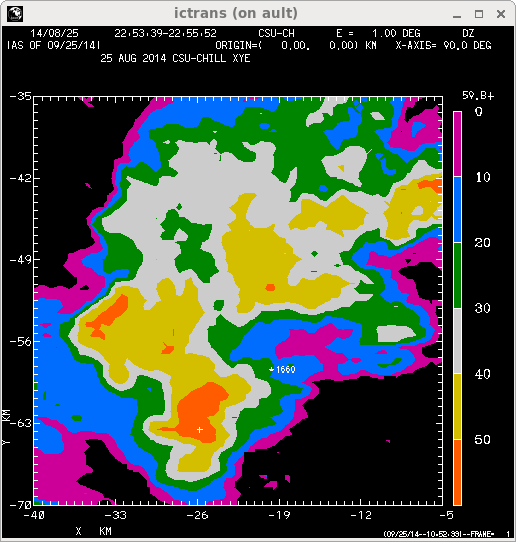
Reflectivity loop
The following loop shows the time sequence of 1.0 deg elevation PPI sweep data from the CSU-CHILL radar. The original polar coordinate gate data have been interpolated to a 500m horizontal mesh Cartesian grid on the PPI surface using the NCAR Radx2Grid program. The gridded data has been plotted using the CEDRIC software developed at NCAR. The location of UDFCD gauge number 1660 (South Platte River at Henderson) has been added as a base map point. The reflectivity at the gauge peaked at levels above 60 dBZ around 2307 UTC:
|
|
||
|
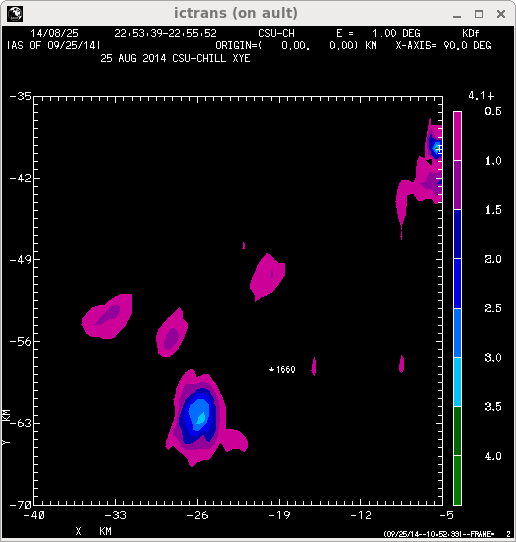
Kdp loop
The specific differential propagation phase was estimated from the basic differential propagation range profile using the methods of Wang and Chandrasekar [Wang and Chandrasekar 2009]. The resultant polar coordinate data field was then interpolated using the same procedures that were applied to the reflectivity data. As shown in the following image loop, values briefly reached 6 - 8 deg / km at gauge 1660:
|
|
||
|
UDFCD gauge 1660 data
The following two plots show the time history of the reflectivity and values extracted from the Cartesian grid point that was closest to gauge 1660. The series of red dots indicates the times associated with the individual bucket tips. The rain gauge data values may contain a time error as precipitation began ~7 minutes after reflectivities of 45 dBZ appeared over the gauge. The gauge also continued to report significant rainfall for several minutes after the reflectivities had tapered off. (The time required for the raindrops to descend from the radar beam height of ~1.2 km to the ground level gauge also contributes to this delay):

The next plot combines the time history with the same bucket tip time points. The steepness of the tip vs. time trend gives the gauge-defined rain rate. Two gray reference lines indicating rain rates of 150 and 180 mm / hr have been added at selected points in the gauge data histories. The highest value in the time series was ~8 deg / km. Using Eq. 8.14 in the Bringi and Chandrasekar (2001) text, rain rates of 237 to 297 mm / hr should be associated at this high magnitude. The maximum gauge-indicated rain rate approached 200 mm / hr:

Hail indications
If hailstones collect in the entrance funnel of the rain gauge, the rain flow rate into the downstream tipping mechanism can be reduced. The following two plots show the reflectivity and differential reflectivity () data at the peak time. The reduced values in the echo core relative to the immediately surrounding areas strongly suggest that quasi-spherical hailstones were mixed in with the rain. An accumulation of hailstones in the inlet of gauge 1660 could have contributed to an undersampling of the true rain rate.


Summary
Both the CSU-CHILL and NWS KFTG radars observed values of ~8 deg / km in the immediate vicinity of UDFCD gauge 1660 on 25 August 2014. The tipping bucket record indicated that peak rain rates of at least 180 mm / hr (7 inches / hr) were present. While these high areas are generally only a few km in size, their associated extreme rain rates can rapidly overwhelm local drainage systems. The measurements made by dual polarization weather radars allow the evolution of the rain rate field to be monitored with greater accuracy than the earlier techniques that were based only on reflectivity data.
References
- [*Wang and Chandrasekar 2009] Wang, Yanting, V. Chandrasekar, 2009: Algorithm for Estimation of the Specific Differential Phase. J. Atmos. Oceanic Technol., 26, 2565–2578.
- Bringi, V.N. and V. Chandrasekar, 2001: Polarimetric Doppler Weather Radar: Principles and Applications, Cambridge University Press