DPWX/High time resolution observations of a heavy rain area: 3 August 2013
Author: Patrick C. Kennedy

Thunderstorms extending across several Colorado counties as shown by CSU-CHILL reflectivity data collected in a 1.7 deg elevation angle PPI scan on 3 August 2013. High resolution (~1 minute scan interval) time lapse image loops documenting the evolution of the low level reflectivity and radial velocity fields in the echo area immediately southeast of the radar have been assembled.
Introduction
Widespread thunderstorm activity developed in the CSU-CHILL coverage area during the afternoon hours of 3 August 2013. Shortly after a thunderstorm passage at the radar site, the scan regime was changed to a continuous series of 360 degree surveillance sweeps at a single elevation angle (1.7 degrees). The 6 deg per second scan rate provided a new sweep at essentially one minute intervals. This high time resolution made some aspects of the echo system evolution more evident.
Reflectivity loop
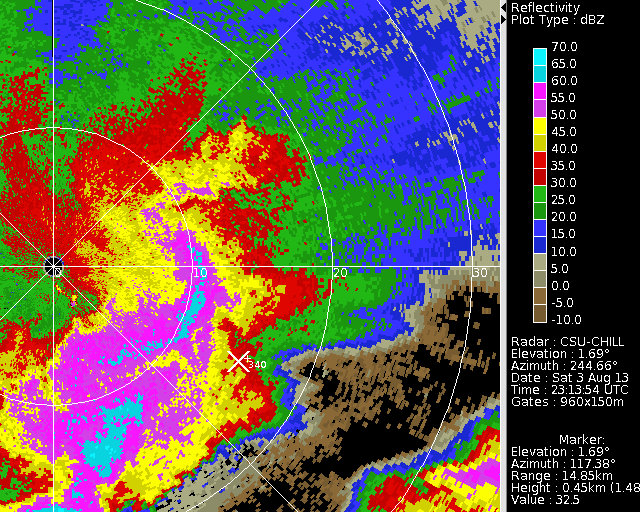
The following image loop shows the evolution of the reflectivity field at the 1.7 degree elevation during the 2313 - 2355 UTC time period. At the initial time, maximum reflectivities exceeding 60 dBZ were present in the vicinity of the 10 km range ring. This high reflectivity area gradually moved eastward and weakened over the duration of the image loop. A portion of this high reflectivity area affected Weld County station number 340 of the Community Collaborative Rain, Hail and Snow Network CoCoRaHS, marked near the white cross symbol in the images. Differential echo motions produced a counter-clockwise echo circulation pattern in the area located just northwest of station 340.
|
|
||
|
Radial velocity loop
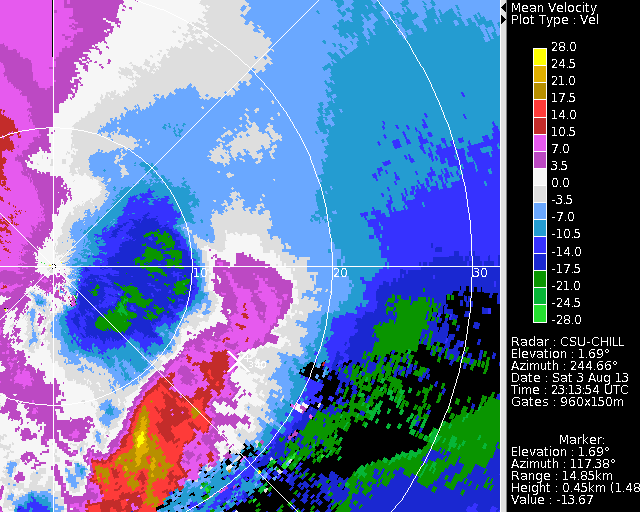
The following loop shows the radial velocity patterns recorded during the same time period as the above reflectivity loop. In the begining of the image sequence, a well defined divergence signature was present near the 10 km range ring. (Positive / outbound / purple-yellow colors at greater ranges and negative / inbound / blue-green colors at closer ranges along radials in the southeast azimuth quadrant.) With time, this divergence signature fades as the outflowing cold air pool beneath the weakening thunderstorms became more shallow and subsided below the PPI scan plane. Eventually, the general negative / inbound radial velocities associated with the ambient easterly low level flow become predominant.
|
|
||
|
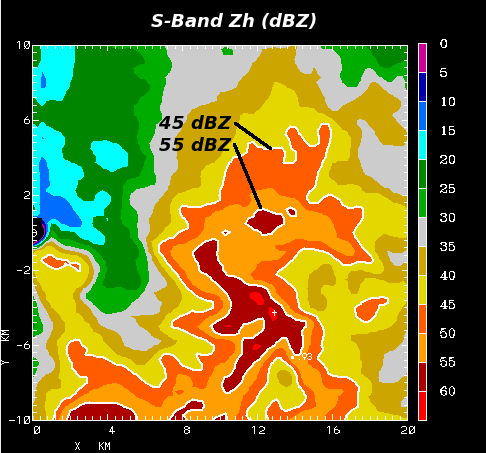
Large specific differential propagation phase magnitudes
The thunderstorms included in the time lapse loops produced locally heavy rainfall as evidenced by small regions with large positive specific propagation differential phase () values. Positive develops along radar beam path segments where high concentrations of oblate rain drops exist. is also inversely proportional to the radar wavelength, so will increase as the radar wavelength decreases. This effect can be seen in the final image sequence that was assembled from the 2324 UTC sweep data. The first two plot frames show the echo configuration in terms of the S-Band reflectivity and radial velocity fields respectively. (Use the forward button to advance through the plots.) The second two frames show the S and X-Band fields obtained from the CSU-CHILL's dual frequency configuration. The X-Band magnitudes are nearly 3 times larger than those obtained at S-Band. (Due to differences in the antenna beam pattern widths and range resolutions in the S and X-band channels, the ratio is somewhat less than 3.45 ratio between the CHILL's two specific operating frequencies.) In any event, these large values imply instantenous rainfall rates of ~300 mm / hr. CoCoRaHS staion 340, which did not experience the peak values, reported a 24 hour precipitation total of 0.93 inches (23.6 mm).

|
|
||
|