DPWX/Evolution of boundary layer echoes: 27 March 2015
Author: Patrick C. Kennedy

Boundary layer echoes observed in a CSU-CHILL RHI scan during fair weather on 27 March 2015. Time lapse loops have been prepared showing the evolution of both the elevated Bragg scattering layer and the surface-based insect echo.
Overview
Mostly clear skies existed at the CSU-CHILL radar site during the afternoon hours of 27 March 2015. Sounding data from the NWS Denver site showed that the base of a dry, stable layer existed around 4 km AGL. Solar warming of the ground surface promoted convectively driven vertical circulations within the boundary layer. Although some shallow cumulus clouds developed, there was no radar or visible evidence of precipitation. During a portion of the afternoon hours, the CSU-CHILL radar conducted a continuous series of low evelvation angle surveillance scans followed by a continuous series of RHI scans. The image sequences generated from these scans reveal several aspects of S-band (3 GHz) boundary layer echo development observed from "clear air" scatterers.
Reflectivity loop
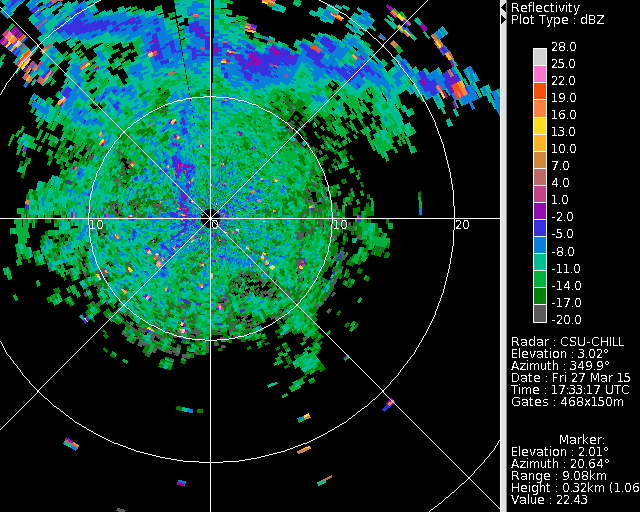
The following reflectivity images were extracted from the 3.0 deg elevation full PPI scans that were done at ~4 minute intervals. An approximately east-west oriented band of enhanced (but still low) reflectivitiy moves southward over the radar during the time period of the loop (1733 - 1931 UTC). Outside of this echo line, the mottled reflectivity patterns imply the existence various small scale vertical circulations.
|
|
||
|
Radial velocity loop
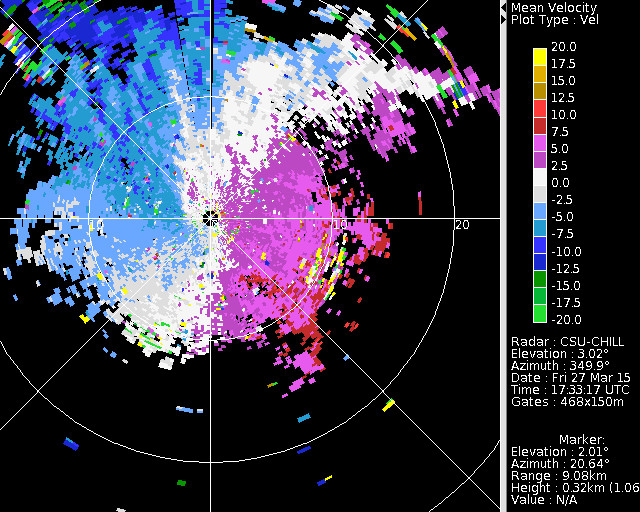
The following loop shows the radial velocity patterns from the same PPI scans that were used in the preceding reflectivity loop. The passage of the echo line was associated with a shift in the low-level wind direction from westerly to northwesterly; the wind speeds also increased appreciably. (This can be seen by alternating between the first and last loop frames.)
|
|
||
|
RHI reflectivity loop
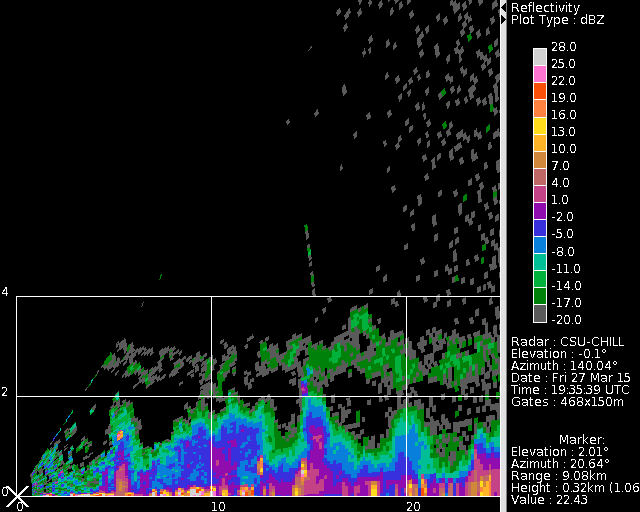
Following the PPI scan interval shown above, the radar shifted into continuous RHI scan mode. These two-sweep RHI volume were oriented along the echo line located southeast of the radar. (Up sweep azimuth of 136 degrees and down sweep azimuth of 140 degrees.) The following image loop was assembled from the 140 degree azimuth reflectivity images. Reflectivities were the strongest at near-surface heights. Based on the highly positive values in the surface layer (data to be shown later), insects were probably responsible for the low altitude echo. A separate, perturbed layer of very low reflectivity was consistently present in the 3 - 4 km AGL height levels. This elevated echo was probably due to Bragg scattering generated by turbulence-driven moisture and temperature perturbations along the base of the stable layer that capped the boundary layer. The smaller-scale "mantle echoes" occurred in the sharp thermodynamic gradients along the sides and tops of cumulus clouds [Knight and Miller 1993]. The amplitude of these cumulus cloud echoes and the average height of the Bragg scattering layer is also seen to increase with time. (Note: The unequal range and height axis scaling in these plots causes the echo patterns to be stretched in the vertical in the loop image frames).

|
|
||
|
Data from selected times
The following photograph of the sky was taken looking southeast from the radar site at 1948 UTC. The RHI azimuths are located near the center of the image. The clouds are fair weather cumulus. The vertical development of these clouds typically stops when they are unable to penetrate elevated "capping layers" of high thermal stability.

The next RHI shows the reflectivity and differential reflectivity () data observed at very nearly the same time as the preceding photograph. As noted earlier, the boundary layer values are on the order of +7 dB, indicative of the highly oblate cross sections of insects. In contrast, the chaotic turbulent motions associated with the Bragg echoes tend to return nearly equal horizontally and vertically-polarized returned signal levels, yielding ~0 dB values. Similar results have been reported by Wilson et al [Wilson et al 1994: Fig. 9]

The final plot is a similar , plot taken from a later time (2010 UTC) when a cumulus cloud mantle echo was more evident. The contrasting regimes between the insect and Bragg layers was maintained throughout the observational period.


References
- [*Knight and Miller 1993] Charles A. Knight and L. J. Miller, 1993: First Radar Echoes from Cumulus Clouds. Bull. Amer. Meteor. Soc., 74, 179–188.
- [*Wilson et al 1994] James W. Wilson, Tammy M. Weckwerth, J. Vivekanandan, Roger M. Wakimoto, and Robert W. Russell, 1994: Boundary Layer Clear-Air Radar Echoes: Origin of Echoes and Accuracy of Derived Winds. J. Atmos. Oceanic Technol., 11, 1184–1206.