DPWX/Dual Doppler analysis of horizontal winds in a thunderstorm anvil: 12 June 2017
Author: Patrick C. Kennedy

Severe thunderstorms as observed in the reflectivity field in a 0.9 deg elevation angle surveillance scan done by the NWS Cheyenne WY radar at 2208 UTC on 12 June 2017. Radial velocity data from this KCYS volume was combined with CSU-CHILL velocity data collected at the same time to synthesize the horizontal wind field at the anvil level of this storm complex.
Overview
During the afternoon hours of 12 June 2017 several severe thunderstorms moved across the northwestern half of the CSU-CHILL coverage area. Storm Prediction Center spotter reports included hailstone diameters of 4.25 inches near Pierce Colorado at 2200 UTC and confirmed tornado activity beginning just south of Hereford at 2250 UTC. CSU-CHILL radar observations of the thunderstorm activity was primarily done using PPI sector volume scans. Two sweep RHI volumes were also done to examine microphysically interesting areas. By coincidence, the CSU-CHILL and the NWS Cheyenne WSR-88D radars both started volume scans at 2208:47 UTC. This pair of synchronized volume scans formed the input to a dual Doppler analysis that was done using the NCAR CEDRIC software package. This presentation primarily considers the dual-Doppler based horizontal wind field patterns in the anvil portion of the echo system.
The visible wavelength GOES 16 satellite image shown below depicts the overall cloud field in the area of interest at 2210 UTC. The updrafts in the active convection along the Colorado - Wyoming border were generating overshooting tops. The anvil cloud associated with this convection extended across southeastern Wyoming into southwestern Nebraska. (GOES 16 image provided by Dan Lindsey from the CIRA group at CSU).

The following plot shows the the CSU-CHILL reflectivity and unfolded radial velocity fields in the 6.2 degree elevation sweep of the 2208:47 volume. This elevation angle intercepted two intense reflectivity cores as well as their extensive downstream anvil echo. The radial velocities are almost entirely positive (i.e., away from the radar). The radial velocity magnitudes varied across the anvil region, with some areas exceeding +45 mps.

Dual Doppler and Lightning Mapping Array analyses at 9 km MSL
The 9 km MSL level captured several interesting features in terms of both the dual-Doppler derived horizontal winds and the Lightning Mapping Array (LMA) data. The horizontal winds were synthesized from the unfolded radial velocities recorded by the KCYS and CSU-CHILL radars in their respective 2208:47 UTC volume scans. The radar data was interpolated to a common 3D Cartesian gridpoint network with a 500 m mesh size; the grid origin is located at CSU-CHILL. Based on the mean echo motion from the south-southwest, the gridded radar data was advected to an analysis time of 2210 UTC.
The 3D locations of lightning discharges were observed by the Northern Colorado Lightning Mapping Array (LMA) system. The individual stations in the LMA network record the arrival times of VHF discharges that are most commonly generated as negatively charged stepped leaders propagate into regions of positive charge. The differences in the discharge arrival times across the LMA station network allows the 3D locations of the discharges to be determined with high resolution in space and time (Thomas et al 2004).
The following "animation" interface provides a sequence of four presentations of radar and LMA data at the 9 km MSL level. The sequence is best viewed by manually stepping ahead using the "Fwd" screen button.
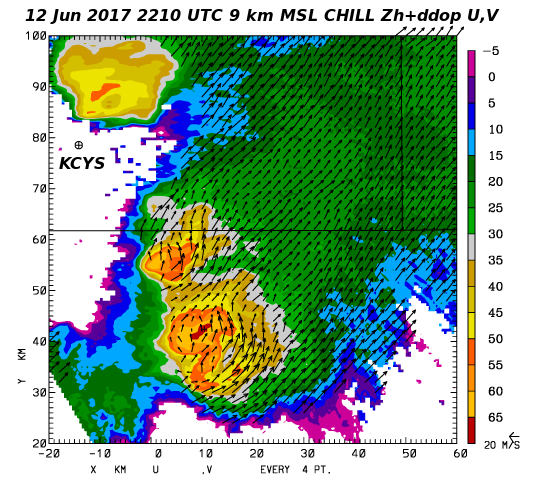
Frame 1: Earth-relative horizontal wind vectors plotted over the CSU-CHILL reflectivity contour field. Maximum reflectivities exceed 60 dBZ in the two storms of interest. The northern storm was crossing the Colorado-Wyoming border, while the larger southern storm was located ~40 km north of CHILL. An extensive region of lower reflectivity anvil echo extended towards the northeast into both Wyoming and Nebraska. Locally accelerated cyclonic flow perturbations were present near the southern flanks of the two thunderstorm cores.
Frame 2: Shows the Frame 1 plot repeated with an overlay of plus symbols marking the locations of LMA discharges detected in the 8 to 10 km MSL height layer during the one minute period starting at 2212 UTC. This was an arbitrary time selection designed to emphasize the later portion of the radar volume scans when the antennas were sampling at higher, anvil-level elevation angles. Discharge points associated with received power levels greater than 20 dBW are plotted in red. The LMA data distribution indicates a high discharge density in the immediate vicinity of the echo cores and a lower density of longer path, higher-powered discharges in the downstream anvil region.
Frame 3: The color fill is the horizontal wind speed calculated from the dual-Doppler U,V values. Locally enhanced wind speeds are generally found in the areas flanking the thunderstorm reflectivity cores. The strongest winds exceed 50 mps just southeast of the bounded weak echo region (BWER) associated with the strong updraft in the southern storm.
Frame 4: Shows Frame 3 repeated with the same LMA discharge symbol over plot that was shown before. There is some suggestion that the discharges in the southeastern portion of the anvil echo over Colorado were occurring in an area of accelerated horizontal flow. This accelerated flow would promote the general advection of hydrometeors from the main updraft area into the downstream anvil. Many of the ice particles in this flow would have become positively charged during rebounding collisions in the main storm updraft. The resultant accumulation of positive charge in the anvil would support the strong LMA activity that was detected in this echo area. These basic patterns are consistent with those found in a much more in depth analysis of the electrification patterns in a supercell thunderstorm reported by Bruning et al. (2010).
|
|
||
|
2213 UTC RHI scan data
Following completion of the 2208 UTC volume scan, the CSU-CHILL radar executed an RHI sweep through the inflow region of the southern storm. The following plot shows the location of the 015 degree RHI plane with respect to the low level (3 km MSL) gridded reflectivity field.

The final two plots show the reflectivity and unfolded radial velocity data in the 015 degree RHI sweep at 2213 UTC. In these images, the polar coordinate RHI data was interpolated to a Cartesian grid aligned with the scan plane. The gridpoints in this plane have a range spacing of 500 m and a height spacing of 300 m; the gridpoint heights are referenced to sea level. Both of these plots also contain a white contour that encloses the area where negative specific differential propagation phase (Kdp) below -0.3 degrees per km were observed in the CSU-CHILL S-band data. Such negative Kdp areas in the sub-freezing levels of thunderstorms often indicate the presence of vertically-oriented electric field magnitudes that are strong enough to rotate the long axis of ice crystals away from their aerodynamically-favored horizontal orientation. As this more vertical alignment becomes impressed on a sufficient concentration of ice crystals, the propagation of vertically-polarized radar waves slows relative to that of the horizontally-polarized waves, producing negative Kdp. In the "snapshot" RHI data shown below, the negative Kdp area was found just above the BWER in the strong (~+40 mps) outbound radial velocities in the upper level divergence pattern present at anvil levels. This implied electric field / thunderstorm airflow configuration is consistent with general dual-Doppler analysis results.


References
Bruning, E.C., W.D. Rust, D.R. MacGorman, M.I. Biggerstaff, and T. J. Schurr, 2010: Formation of charge structures in a supercell. Mon. Wea. Rev., 138, 3740-3761. doi:10.1175/2010MWR3160.1
Thomas, R.J., P.R. Krehbiel, W. Rison, S.J. Hunyady, W.P. Winn, T. Hamlin, and J. Harlin, 2004: Accuracy of the Lightning Mapping Array. J. Geophys. Res., 109, D14207. doi:10.1029/2004JD004549.