DPWX/Dual-polarization radar indications of ice crystal canting due to electric fields: 5 June 2015
Author: Patrick C. Kennedy

CSU-CHILL reflectivity data observed in a 1.8 degree elevation angle PPI sweep completed at 0200 UTC on 5 June 2015. Dual polarization data collected in an RHI scan through the circled thunderstorm showed indications that ice crystals in the upper portions of the storm had been rotated towards a vertical orientation due to the effects of strong electric fields.
Overview
The CSU-CHILL radar conducted low elevation angle PPI scans for precipitation mapping purposes during an outbreak of severe weather in the evening hours of 4 June 2015 (5 June on UTC). A few RHI scans were also done. In one such RHI sweep near 0158 UTC, several of the dual-polarization data fields contained evidence of ice crystal re-orientation due to electric field effects. The aerodynamic forces acting on planar ice crystals tend to keep the crystal's major axis in a quasi-horizontal orientation as they fall towards the ground [List and Schemenauer, 1971]. This preferred crystal orientation can be altered by sufficiently strong external electric fields. The charge dipole structure in the water molecules composing the ice crystal structure causes these cloud particles to tend to rotate into alignment with the lines of an externally-applied electric field. Thus, areas where dual polarization radar data indicate that the average ice crystal orientation has been appreciably altered from the horizontal probably contain strong electric fields. The development of lightning discharges is favored in these high electric field strength areas [Caylor and Chandrasekar, 1996].
KFTG data
Since the CSU-CHILL radar was not scanning at high elevation angles, data collected by the NWS KFTG radar located near Denver, Colorado was examined to provide an overview of the echo situation. The following plot shows the KFTG reflectivity pattern in the 6.4 degree elevation angle sweep at ~0156:30 UTC. The highlighted 35 and 55 dBZ contours identify the thunderstorm cores of interest. The orientation of the CSU-CHILL RHI scan done near 0158 UTC is also marked. This RHI scan intercepted portions of the storm centered at X= -58, Y= 47 km from KFTG. (Red-colored portion of the RHI line). The KFTG beam height in the vicinity of this storm is ~7.4 km MSL / ~6 km above the ground level at CHILL.

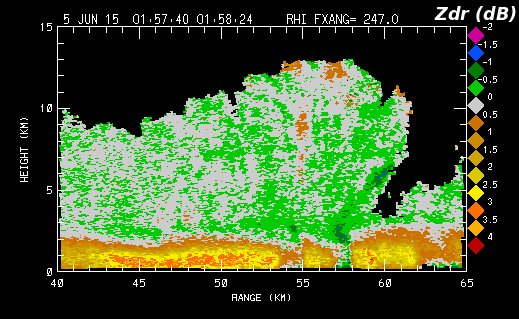
The following plot shows the differential reflectivity (Zdr) data in the same KFTG sweep. The NWS WSR-88DP radars make dual polarization measurements by simultaneously transmitting horizontally and vertically polarized pulses (called herein the VHS operating mode). Coupling between the returns of the H and V waves will occur when these VHS transmissions propagate through non-spherical hydrometeors that are oriented with a mean canting angle that differs from zero degrees. As ice crystal orientations rotate towards the vertical, the resultant VHS mode coupling produces radially-oriented stripes of enhanced positive and negative Zdr values [Hubbert et al, 2010].

CSU-CHILL RHI data
The next two plots show the basic reflectivity and radial velocity patterns observed in the the 247 degree azimuth RHI conducted by the CSU-CHILL radar approximately two minutes after the KFTG sweep shown above. The reflectivity data indicated that the echo summit approached 14 km AGL (15.4 km MSL) near the 55 km range.

The corresponding radial velocity field contained strong storm-top divergence. It can be inferred that this divergence was driven by the interaction of an intense updraft with the increasing static stability at the tropopause. This updraft provided an environment in which ice particle collisions occurred in the presence of supercooled water droplets; a regime where the non-inductive charging process was probably active.

Selected dual polarization fields from this RHI scan have been collected into the following image loop sequence. Instead of a continuous animation, it is recommended that the "Fwd" button be used to step through the images. The CSU-CHILL polarimetric data was collected using the alternating polarization mode (H polarized pulse followed by a V polarized pulse at the next PRT) vs. the VHS method employed by KFTG. Zdr measurements made in this alternating operating mode is not affected by cross coupling. The CHILL Zdr field (frame number 1) is relatively featureless in the sub-freezing portions of the echo. The effects of the oriented ice crystals are masked by the larger diameter, higher reflectivity, quasi-spherical (~0 dB Zdr) aggregated ice particles [Hubbert et al, 2014]. In contrast to Zdr, specific propagation differential phase (frame number 2) is sensitive to the presence of oriented, non-spherical hydrometeors . As the mean ice crystal orientation becomes quasi-vertical due to electric field effects, the propagation of the V waves is slowed relative to the H wave speed. This difference leads to the fractionally negative Kdp values that were best defined in the 7 - 9 km AGL layer. Enhanced Linear Depolarization Ratio (LDR) values extended upwards to somewhat greater heights (i.e., above ~8 km AGL). LDR is maximized when the hydrometeor's major axis is rotated to 45 degrees since this angle most effectively backscatters the incident H waves into the V cross-polar plane. The 45 degree orientation angle also maximizes the correlation coefficient between the co-polar H and cross-polar V received signals. This correlation (multiplied by 10) is shown in frame number 4. The most organized region of high (> ~0.75) correlations was observed in the general vicinity of the updraft summit at heights above 10 km AGL. The dual polarization fields shown in this image sequence all imply that a strong electric field was present at heights above ~6 km AGL in the vicinity of the RHI scan plane.
|
|
||
|
LMA (Lightning Mapping Array) data
The Northern Colorado LMA system uses a network of ~12 ground-based receivers to monitor the arrival time of the bursts of VHF radiation that are generated by the step-wise advance of lightning channels through the atmosphere. The varying station arrival times observed from a given discharge event allow the 3D location of the discharges to be calculated as a function of time. The RHI scan shown in the above plots was done with the antenna moving downwards. An examination of the individual ray times showed that sampling of oriented ice crystal region was completed at 0158: 08 UTC. The next plot shows the locations of the LMA discharges that were detected in the immediately following three second period (0158:08 through 0158:11) in the 7 to 13 km AGL height layer. The X and Y axes are marked in km distances with respect to CSU-CHILL and the location of the 45 - 60 km portion of the RHI sweep is highlighted. At least two clusters of LMA discharge points occurred in close proximity to the re-oriented ice crystal signatures that were observed in the RHI data.

References
- [*Caylor and Chandrasekar, 1996] Caylor, I. and V. Chandrasekar, 1996: Time-varying ice crystal orientation in thunderstorms observed with multiparameter radar. IEEE Trans. Geosci. Remote Sens., 34, 847–858.
- [*Hubbert et al, 2014] Hubbert, J.C., S.M. Ellis, W.-Y. Chang, S. Rutledge, and M. Dixon, 2014: Modeling and Interpretation of S-Band Ice Crystal Depolarization Signatures from Data Obtained by Simultaneously Transmitting Horizontally and Vertically Polarized Fields. J. Climate and Appl. Meteor., V53, pp. 1659 - 1677.
- [*Hubbert et al, 2010] Hubbert, J.C., S. M. Ellis, M. Dixon, and G. Meymaris, 2010: Modeling, Error Analysis, and Evaluation of Dual-Polarization Variables Obtained from Simultaneous Horizontal and Vertical Polarization Transmit Radar. Part II: Experimental Data. J. Atmos. and Ocean. Tech, V27, pp 1599 - 1607.
- [*List and Schemenauer, 1971] List, R. and R. Schemenauer, 1971: Free-Fall Behavior of Planar Snow Crystals, Conical Graupel and Small Hail. J. Atmos. Sci., v28, pp. 110 - 115.
Acknowledgments
Dr. John Hubbert of NCAR's EOL division provided a technical review of this article.