CHILL Signal Processor
This is a description of the Signal Processing hardware and algorithms used by the CSU-CHILL radar system.
Clutter Filtering
Selectable clutter filtering can be applied to the received data. Currently, IIR clutter filters are available, these will be augmented by the spectral filters currently under development. The clutter suppression achieved by CHILL is about 40-45 dB. This is mostly due to 60 Hz amplitude modulation of the Klystron beam current.
IIR Chebyshev/Elliptic Filters
Several IIR filters of various filter depths and other characteristics are available to the processor. These are listed in the table below. Each filter type has a selectable filtering notch width, selectable from 0.5 m/s to 3 m/s (two-sided) in increments of 0.5 m/s. The filters can be dynamically switched from scan to scan.
| Filter Type | Description |
|---|---|
| Third-order Elliptic | Provided for compatibility with older scans |
| Fifth-order Chebyshev Type II | Provides good clutter filtering, with a flat passband at non-zero doppler velocities |
| Fifth-order Elliptic | Better clutter rejection than a Chebyshev Type II, sharper transition band, passband is not flat for non-zero doppler velocities |
IIR filters have a side-effect of ringing when excited by strong gradients in power in the azimuth direction. This is particularly true for high scan speeds (greater than 12°/s) or for long-range modes. This must be borne in mind when specifying the clutter filter type and notch width.
Spectral Domain Filters
Newer clutter filtering algorithms that operate in the spectral domain are currently under development. These filters are generally FIR types, and hence do not suffer from excessive ringing in sample time.
Moment Processing
Tools
A variety of real-time processing and data visualization tools have been developed in house, which directly interface to the signal processor system through the same gigabit Ethernet LAN used by the signal processor itself.
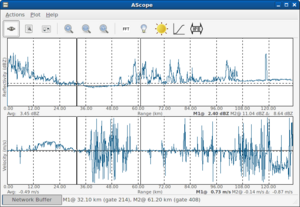
A-scope

The A-scope is designed as a quick-look program, to determine the current operating state of the radar hardware and digitizer. The intended use of the program is as a diagnostic tool for discovering faults in the radar system. As a result, it is designed as a stand-alone system, meaning that it does not require a moment processor to be running; it acquires the raw time-series data directly from the acquisition server. It calculates moment data from the time-series, although these moments may not have all the appropriate calibrations applied. Variables available for display are listed in the table below. A pair of markers can be placed in range, and the corresponding value from the traces can be read out.

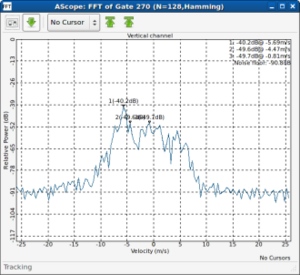
Since it has access to time-series, the program can also generate real-time spectral plots of the data. An example is shown in the figure below. The FFT display has a handy peak-find and peak marker display, as well as noise-floor calculation. Cursors may be placed on either axis, to read off values. The Range gate from which the FFT is calculated can be selected using a cursor on the main display. A variety of options may be set, including the FFT size (no. of points), window function and channel (V or H).
Other features included in this program are a solar calibration module, which shows a graphical plot of received power (or any other variable) versus antenna angle relative to the sun-pointing position, a power calibration module, which generates receiver calibration curves and an HP-IB controller, which allows the operator to control the instruments attached to the radar HPIB bus (such as test set and power meters)
Radar Status Viewer

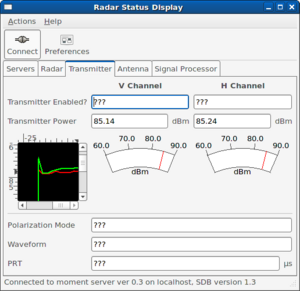
The radar status display is a utility to show the current operating state of the radar and signal processing systems. It monitors the state of the transmitter, antenna positioner and the signal processor. Its displays give an instantaneous snapshot view of the radar, and it is able to automatically flag error conditions such as transmitter power out of spec, antenna slew speed out of tolerance, etc. The thresholds for these error conditions can be set from user preferences. It can also generate an audible alarm sound when any combination of these parameters go out of tolerance.
A graphical strip-chart of the transmitter power is also presented, to track potential drifts in transmitter power when varying the transmitter triggering modes. Also shown are graphical presentations of antenna pointing position.
Real-time Display
Main article: Real-time Display
The CHILL Real-time Display is a radar visualization tool, which allows the radar variables generated by the signal processor to be viewed in a variety of ways. The display communicates via the VCHILL protocol to the signal processor. Scan conversion of the incoming data from polar (r-θ) to Cartesian coordinates is done in software using an algorithm that is guaranteed to not generate "holes" in the display, while not producing overlap. The display program can be run both onsite as well as remotely through a network connection.
VCHILL
Main article: VCHILL
The Java VCHILL viewer is a radar display program designed for remote browsing of the CHILL data archive. Additionally, it can also display real-time data. Written in Java, it offers platform independence.