Brightband observations: 12 September 2009

Copolar correlation () data observed in an RHI sweep through stratiform rain on 12 September 2009. Selected plots of these dual polarization observations of the melting level/brightband have been prepared.

Introduction
Frozen hydrometeors begin to melt as they descend through the 0°C environmental temperature level. The general transition from a frozen to a liquid thermodynamic phase increases the dielectric factor in the radar equation () by a factor of ~5 (0.19 to 0.93). This acts to enhance radar reflectivity levels at heights just below the melting level. Also, particles that collide at these temperatures tend to stick together due to their wet surfaces. The resultant large diameter aggregates also increase the radar reflectivity factor. Once the hydrometeors fully melt into compact raindrops, their terminal fall speeds increase relative to that of their incompletely-melted neighbors. This fall speed increase locally reduces the particle concentrations as the fraction of liquid particles increases. The net result of these backscattering enhancements and fall speed divergence effects is the relatively thin layer of increased radar reflectivity that has been historically referred to as the "bright band". (Note: This bright band description is valid for Rayleigh scattering conditions. Quite different patterns appear when the melting level is observed at shorter wavelengths. See Sassen et al., 2005)

RHI Data
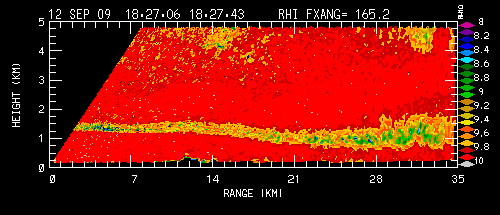
The following sequence of RHI sweeps was made by the CSU-CHILL radar on a day when widespread rain of variable intensity was occurring. The enhanced reflectivity layer associated with the melting level is evident at ~1.4 km AGL. A region of higher reflectivity associated with a shower can also be seen to approach the radar with time:
|
|
||
|

In addition to reflectivity enhancement, the melting layer is also associated with several patterns that are recognizable in dual-polarization radar observations. One of the most distinctive of these is a localized reduction in the correlation between the horizontally and vertically polarized co-polar signal returns (). The diverse mixture of particle types (i.e., both fully melted small drops and large, irregular, partially-melted aggregates) in the radar pulse volume results in a distinct reduction in within the general melting layer. In the following image loop, the reduced layer becomes thicker and lower in the heavier rain shower area. The longer time necessary to fully melt the larger diameter hydrometeors in the heavier shower acts to thicken and depress the melting layer.
The values have been scaled up by a factor of 10 in these images; 8.6 color scale value equals 0.86
|
|
||
|
Extracted Vertical Data Profile
The following plot shows a more detailed view of several radar variables in a vertical profile through the melting layer. The data were taken from the 5 - 6 km range interval in the 1848 UTC RHI volume scan. The height scale is reference to sea level; the height of the 0°C level in the 00 UTC 13 September 2009 Denver sounding (3330 m MSL) is marked near the right edge of the plot. Reflectivty enhancement starts to appear roughly 100 m below the 0°C height. The minimum occurs below the height of maximum reflectivity. Differential reflectivity () peaks at a still lower height where the presence of large, water-soaked aggregates probably maximizes the strength of the H return signal relative to that of the V signal. This vertical structure is in agreement with that reported by Zrnic et. al. (1993). Finally, a broad enhancement in Linear Depolarization Ratio (LDR) is evident through the lower ~1/2 of the melting layer. The wobbling motions of the melting, non-spherical aggregate-type particles increase the level of the cross-polar component of the return signal. Below ~2.4 km MSL, the radar data values have become typical of those observed in rain.


References
- Sassen, K., J. R. Cambell, J. Zhu, P. Kollias, M. Schupe, and C. Williams, 2005: Lidar and Triple-Wavelength Doppler Radar Measurements of the Melting Layer: A Revised Model for Dark- and Brightband Phenomena. "J. Appl. Meteor".,44,301-312.
- Zrnic, D. S., N. Balskrishnan, C. L. Ziegler, V. N. Bringi, K. Aydin, and T. Matejka, 1993: Polarimetric Signatures in the Stratiform Region of a Mesoscale Convective System. "J. Appl. Meteor.",32,678-693.