Bounded weak echo region (BWER) example: 9 June 2011

Radial velocity patterns observed in a CSU-CHILL RHI scan through a Bounded Weak Echo Region (BWER) in a hail-producing thunderstorm. Selected plots of both PPI and RHI scans through the BWER area have been collected.
Introduction
A marginally severe thunderstorm (one report of soft, one inch diameter hail) was observed during the early evening hours of 8 June 2011 (9 June on UTC). Despite its modest stature and severe weather production, the storm contained a well-defined Bounded Weak Echo Region (BWER). These vertically-oriented weak signal intrusions into the overall thunderstorm echo are associated with strong updrafts. Due to the strong rising motions, the growing hydrometeors are carried up to relatively high altitudes before they become large and numerous enough to produce a radar echo (Lemon and Doswell, MWR 1979). The observations reported here were taken when the storm was approximately 70 km southeast of the CSU-CHILL radar. The following base map plot shows some basic geographic and horizontal scaling information:

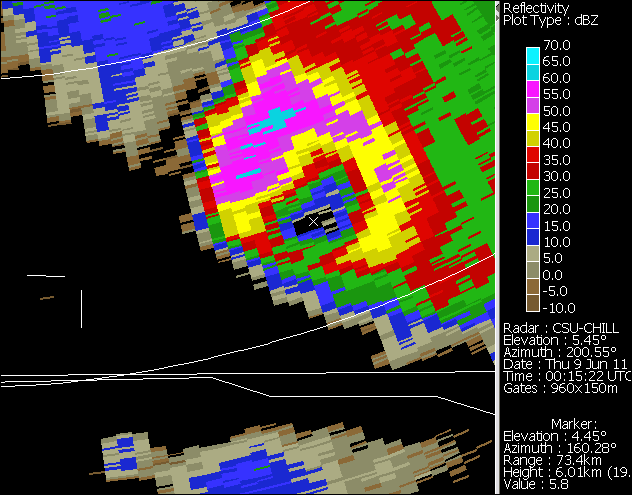
PPI data from the 0013:33 UTC volume
The first frame in the following plot sequence shows the reflectivity field observed in a PPI sweep done at an elevation angle of ~5 degrees. A cursor cross has been placed in the echo hole associated with the BWER. The second frame contains the reflectivity data from the ~7 degree sweep. At this beam height, the BWER reflectivity minima no longer exists; instead, relatively high reflectivities are found due to the growing hydrometeors that exist at this level in the updraft. (The cursor location is fixed). The third frame shows the radial velocity pattern in the 7 degree PPI sweep. Divergence is clearly indicated in the echo region overlying the BWER updraft. (Clicking the "Fwd" button on the control panel below the image is the best way to step through the three images.)
|
|
||
|
RHI data from the 0021:28 UTC volume
The following plot was generated from an RHI scan made on an azimuth of 158 degrees ~5 minutes after the time of the PPI's shown above. Reflectivity is shown in the left panel; the overhanging structure associated with the BWER is evident. The right panel shows radial velocity. Significant changes in the orientation of the zero velocity line are found in the overhang region: In the further range part of the echo overhang, the zero velocity line is aligned more or less radially with respect to the radar. This implies the rotational motion indicated by the pair of black arrows. Near the 71 km range, the alignment of the zero velocity line has re-oriented so that it is essentially perpendicular to the radar radials. The implied divergence pattern near the echo summit is indicated by the pair of red arrows.

Three dimensional visualization of the 0018:26 UTC volume
The reflectivity data in the PPI volume scan that started at 0018:26 UTC (i.e., between the times of the PPI and RHI data shown above) was input to the Gibson Ridge Software GR2Analyst display program. A volume rendering of the storm as viewed from the southwest is shown below. The outer yellow-shaded translucent region depicts reflectivity levels between 39 and 48 dBZ. This reflectivity surface shows the BWER overhang on the southeast side of the storm. The interior red-shaded region contains reflectivity values at and above 61 dBZ. This intense echo core was associated with the report of one inch diameter hail that was received at 0032 UTC.
